


IECE Transactions on Emerging Topics in Artificial Intelligence
ISSN: 3066-1676 (Online) | ISSN: 3066-1668 (Print)
Email: [email protected]

Diabetic retinopathy (DR) is the foremost reason for blindness in the young, a significant complication of diabetes, and a most important public health problem [1]. DR impacts one-third of the 463 million people with diabetes worldwide, and projections by the International Diabetes Federation (IDF) estimate a rise from 552 million in 2035 to 642 million by 2040 [2]. The global prevalence of DR currently affects over 158.2 million people and is expected to exceed 191 million by 2030 [2]. This draining eye disease develops due to prolonged diabetes, causing damage in the retina to the blood vessels, the light-sensitive tissue in the rear of the eye [3, 4]. DR progresses through several stages associated with pathological changes and corresponding visual impairments [5]. Non-proliferative Diabetic Retinopathy (NPDR): In this phase, the blood vessels in the retina lead to microaneurysms (small leaks), haemorrhages (bleeding), and cotton wool spots (damaged areas in the nerve fiber layer of the retina) [6]. The NPDR type is further divided into mild, moderate, and severe based on these abnormalities. Proliferative Diabetic Retinopathy (PDR): In this advanced stage, new blood vessels form on the retina's surface, which are fragile and prone to leaking [7], leading to vision loss. These vessels can block fluid flow in the vitreous, causing vitreous haemorrhage and further impairing vision [8].
Timely detection and intervention are critical to prevent severe vision loss, as DR can progress rapidly [9, 10]. However, conventional DR screening methods require significant time and resources [5, 11, 12, 13, 14]. The physical inspection of retinal images by ophthalmologists, while standard, has limitations due to subjective interpretation and the need for specialized expertise [15, 16, 17]. This makes large-scale implementation challenging. To address these limitations, an intelligent detection system is essential for accurate and efficient early-stage DR diagnosis, increasing accessibility to early intervention.
Our proposed study introduces a deep hybrid model for automated DR classification and detection. The model combines the strengths of VGG16 and Inception V3 Convolutional Neural Networks (CNNs). VGG16 is proficient at capturing detailed features, such as textures and edges, aiding in early DR identification, while Inception V3 detects multiscale patterns and contributes to identifying complex severity levels. We tested the model on EyePACS1 [18] and APTOS2019 [19] datasets, achieving superior results in DR severity classification. Unlike traditional methods, our approach leverages deep learning to extract detailed features from retinal images, significantly improving DR diagnostic accuracy and efficiency.
Suggest a novel deep hybrid model that combines the convolutional neural network (CNN) models, VGG16 and Inception V3, leveraging their complementary strengths to surpass the performance of existing state-of-the-art works, demonstrating models' effectiveness in classifying and detecting DR disease severity levels.
Improve the deep CNN-based early classification and detection system using VGG16 and inception V3 models. The model leads to improved extraction of complex features from retinal images and a more accurate and robust DR diagnosis system.
Demonstrate the effective implementation of the deep hybrid model in real-time diagnosis, highlighting its effectiveness in detecting diabetic retinopathy (DR) and its potential to significantly enhance patient care and decrease the consequences of DR by offering clinicians a robust and efficient DR classification system.
This paper is organized into five sections. Section 1 provides an introduction to the topic. Section 2 offers a detailed review of prior research on the diagnosis of diabetic retinopathy. Section 3 outlines the materials and methods used in the study. Section 4 presents a comprehensive analysis of the results, followed by a discussion of the findings. Finally, Section 5 concludes the paper with a summary of key insights and implications.
This review section highlights prior works on diabetic retinopathy classification and detection. Panwar et al. [20] presented an alternative machine-learning approach to analyzing retinal fundus images to diagnose diabetic retinopathy. Despite the traditionally diverse data and the distribution of disease stages, they trained their model on a large sample of retinal images. Models' performance demonstrated that the overall evaluation of diabetic retinopathy diseases remained high compared to the traditional and prior approaches.
Jain et al. [1] proposed various CNN models, InceptionV3, VGG19, and VGG16 [21], and assessed the models of DR classification concerning labels for two classes and five classes. Results realized the model's performance would be proportional to increased depth in terms of pooling layers and convolutional in CNN. The top precision for two types of DR classification attained 80.40% using VGG19. In a study conducted by Voets et al. [13], authors used ensemble deep learning for binary classification (NRDR-RDR) and InceptionV3 for feature extraction, the model trained on a publicly available dataset, EyePACS. The proposed study provided an AUC of 85.3% on Messidor-2. Another survey study by Toledo-Cortés et al. [16] used InceptionV3 to classify RDR. The authors have recommended a deep-learning Gaussian Process (GP) model using the EyePACS dataset. A GP regression has an AUC of 87.83% on Messidor2. Masood et al. [22] shows an accuracy of 48.2% in DR detection using the transfer learning model on the EyePACS database Inception-V3. Harun et al. [23] discoursed a Multi-layered perceptron trained along Bayesian regularization, achieving an improved classification presentation compared to using Levenberg–Marquardt in training at 72.11% and testing accuracy at 67.47%. The study refers to [24], using the Kaggle dataset and trio neural network models: feedforward neural network (FNN), deep-FNN, and CNN. The best training precision achieved with a deep FNN is 89.6%. Zago et al. [25] achieved the Kappa score (K-Sc) of 0.86 using the public Kaggle dataset and the random forest classifier. The CNN model was used to assess the severity of diabetic retinopathy. Saranya et al. [26] introduced a method for the initial diagnosis of diabetic retinopathy using reflection images, implementing a proposed automatic recognition system. After intensive training on a large corpus of retinal images, the model showed very high accuracy for diagnosis. Yang et al. [27] demonstrated that an SVM and CNN hybrid architecture achieved the highest accuracy in diagnosing diabetic retinopathy. On the other hand, Jabbar et al. [28] proposed a hybrid solution to identify DR concentrated image processing and deep learning together for better examinations of diagnosing from a fundus image. For validation of model 400 retinal fundus images in the Messidor dataset used and assessed with various performance metrics, they attained the promised result with an average accuracy of 97%, 94% recall, Specificity of 98%, precision of 96%, F-score95%, and GMean95%. Jiang et al. [29] used three deep learning models (Inception V3, ResNet151, and InceptionResNet-V2). They attained accuracies of 87.91%, 87.20%, and 86.18%. When they combined models with the AdaBoost algorithm, they reached an even better accuracy of 88.21%. Referring to the study [30], the authors applied transfer learning by stacking CNNs network on topmost of ResNet and Inception-based models to perform multiclass classification of fundus images for blindness detection using the (APTOS) dataset. The pictures underwent pre-processed steps through resizing, obscuring, and BBO operations. Data augmentation is utilized to balance the class data distribution. The study achieved a test accuracy of 82.18% using the APTOS dataset. The authors in [17] proposed a multiclass classification method for eye-related diseases, using CNN-based network architecture for fundus image classification and leveraging the power of transfer learning that groups ocular diseases into their respective classes. They used the Peking University Ocular Disease Intelligent Recognition (PKU-ODIR) dataset, which includes class labels for eight types of ocular diseases.
| Datasets | Training | Testing | Validation | Total Images | Classes | |||||
|---|---|---|---|---|---|---|---|---|---|---|
| Data Division | Images | Data Division | Images | Data Division | Images | |||||
| EyePACS1 | 80% | 28,101 | 10% | 3,513 | 10% | 3,513 | 35,126 | 5 | ||
| APTOS2019 | 80% | 4,467 | 10% | 558 | 10% | 559 | 5,584 | 5 | ||
| Dataset | No DR | Mild | Moderate | Severe | Proliferative DR | Total Images |
|---|---|---|---|---|---|---|
| EyePACS1 | 18,456 | 8,712 | 5,270 | 1,902 | 786 | 35,126 |
| APTOS2019 | 3,005 | 1,117 | 890 | 377 | 195 | 5,584 |
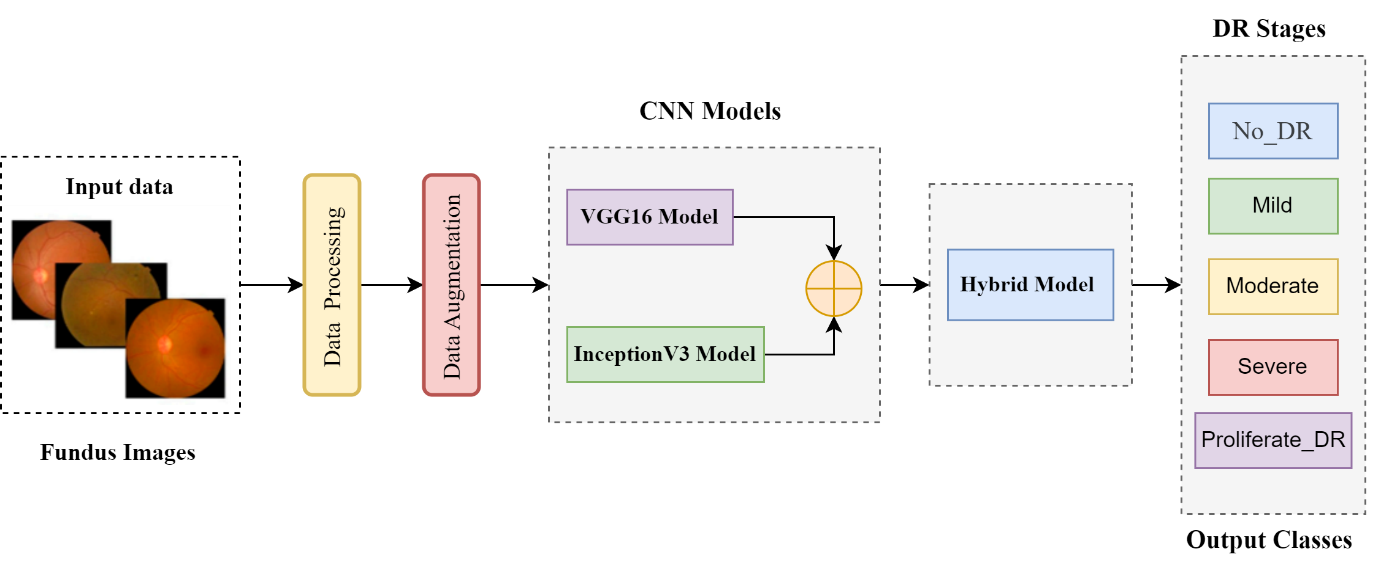
This methods and materials section focuses on the techniques and materials used in our novel study. The fundamental purpose of this study is to propose a novel deep hybrid model for an automated diagnosis of diabetic retinopathy (DR) and enhance real-time early DR stages classification, surpass the previous classification methods with promised performance, and accomplish the desired outcomes in diabetic retinopathy research (DR). Our study leverages the strengths of CNN architectures, such as VGG16 and Inception V3's Transformer Learning models, to identify abnormal features in retinal pictures. The VGG16 model is used because of its ability to identify intricate features like texture and edges, which are crucial for the timely detection of diabetic retinopathy (DR). The Inception V3 model is chosen for its solid pre-training performance and ability to analyze and extract complex and multiple features. It just requires a more remarkable ability to include many variables. The performance assessment of our deep connection model is conducted by assessing the EyePACS1 and APTOS2019 datasets. These two datasets serve as a reliable basis for training and evaluating models under various situations and levels of severity in diabetic retinopathy. They are extensively used and acknowledged in the field of medicine. We use this extensively employed data to evaluate the real-world effectiveness of our novel hybrid model. We conducted independent evaluations of the accuracy of both VGG16 and Inception V3 on these datasets, enabling us to compare them individually and together. The process included acquiring curated datasets and using transformer learning models (VGG16 and Inception V3) to create a deep hybrid architecture. It also included determining parametric settings, training methods, assessment criteria, and model evaluation. We are comparing the findings of our hybrid model with prior cutting-edge approaches to understand how well it can identify and classify different phases of diabetic retinopathy and its overall efficiency. Figure 1 portrays the research flow diagram of the proposed deep hybrid model to diagnose diabetic retinopathy.
We use multiple data from public databases, such as Kaggle datasets: EyePACS1 and APTOS2019. Both image datasets have five categories: "Mild," "Moderate," "Mild," "Severe," and "Proliferating" DR images. APTOS Asia Pacific Teleophthalmology Association created the APTOS2019 database of 5,584 high-resolution images as part of the 2019 Visual Vision Challenge. Furthermore, the California Health Foundation created the EyePACS1 dataset containing 35,126 high-resolution photos for the Diabetic Retinopathy Detection Challenge. These are well-known and widely used datasets designed to study performance models in assessing diabetic retinopathy. Tables 1 and 2 provide detailed statistics of both datasets.
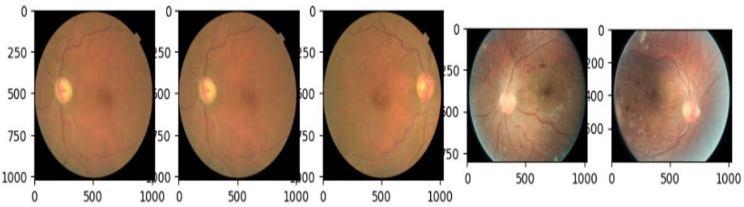
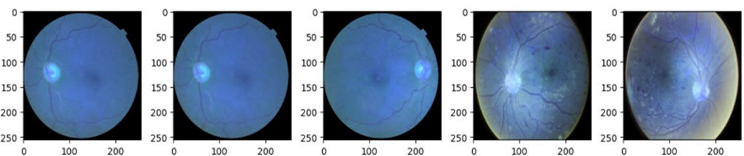
The APTOS2019 and EyePACS datasets lay under varying lighting conditions because both datasets comprise the retinal fundus pictures captured using different cameras with different specifications. In datasets, there are various inconsistencies and unbalanced data. Therefore, to overcome these inconsistencies, all images underwent numerous pre-processing steps to normalize and standardize datasets. Figures 2 and 3 show both datasets' original fundus image samples before applying pre-processing techniques.
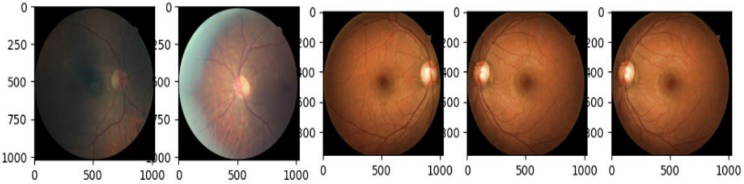
Resizing is a crucial step in the pre-processing of diabetic retinopathy fundus images. Bicubic interpolation is often used for this purpose, as it calculates the weighted average of surrounding pixels, leading to smoother and more visually consistent results. This method is favored because it helps minimize artifacts and distortions during resizing, ensuring the images remain clear and free of visual imperfections. When resizing the image, for each new pixel in the output image, the bicubic interpolation formula is applied using the corresponding neighboring pixels in the original image, calculated as:
The scale factor is the ratio of the output size to the input size in either dimension (horizontal or vertical). The resulting is the interpolated intensity value for the resized image at the location . This process ensures that the resized image maintains smooth transitions and reduces the appearance of artifacts and distortions, producing a high-quality, visually consistent output. After resizing, the photos from both datasets are displayed in Figures 4 and 5.
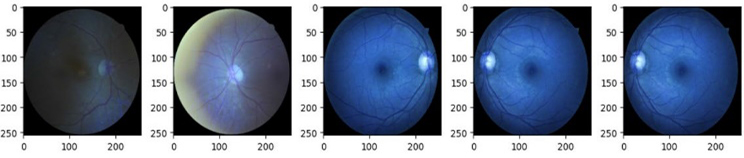
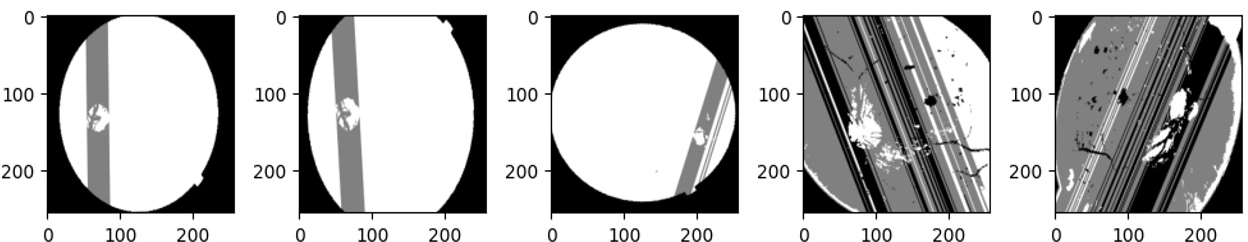
The accomplishment of deep learning models is greatly affected by the size and variety of the dataset. A large and diverse training dataset is essential for avoiding overfitting and ensuring strong generalization. Various techniques, such as flipping, cropping, rotating, and zooming, are applied to enhance the diversity of the images, as illustrated in Figures 6 and 7. These augmentation Figures 6 and 7 highlight the effects of the augmentation techniques on the training dataset, with operations like cropping, rotating, flipping, and shearing being key contributors. This approach significantly enhances the training data representativeness and comprehensiveness, providing a strong foundation for the model's effectiveness.

We use the CNN based on VGG16 architecture to detect DR. We construct the VGG16 model as follows: a model structure consisting of convolutional layers (Conv2d) tailed by the (ReLU) function, which is essential for capturing complex details in retinal fundus images. This VGG16 architecture starts with 13 convolutional layers with a small 3x3 receptive field, permitting the network to learn fine-grained features, such as boundaries and textures, essential for image detection in the early stage of diabetic retinopathy (DR). Batch normalization is used after the normalization function to stabilize and speed up the training process. The max pooling layer is concatenated after every two or three convolutional layers to reduce the width of the feature map, thus subsampling the image for the flexibility of model parameters and preserving the essential features, as shown in Table 3. The VGG16 model eventually consists of three layers, which are ultimately divided into one of five DR weights: "normal," "light," "medium," and "normal." And thus improves the model's generalization ability. Although the VGG16 architecture is straightforward, providing the best performance in image distribution tasks due to its depth and integration design.
| Layer | Type | Parameters | Example Values |
|---|---|---|---|
| Initial Convolutional Layers | Conv2d | Filters: 64, Kernel Size: (3, 3), Padding: (1, 1) | Filters: 64, Kernel Size: (3, 3), Padding: (1, 1) |
| Convolutional Blocks (Blocks 1–5) | Conv2d | Number of Layers: 13, Filters: 64, 128, 256, 512 | Number of Layers: 13, Filters: 64, 128, 256, 512 |
| Max-Pooling Layers | MaxPool2d | Kernel Size: (2, 2), Stride: (2, 2) | Kernel Size: (2, 2), Stride: (2, 2) |
| Fully Connected Layers | Linear | Output Size: 4096, 4096, Number of Classes | Output Size: 4096, 4096, Number of Classes |
| Dropout | Dropout | Dropout Rate: 0.5 | Dropout Rate: 0.5 |
| Layer | Type | Parameters | Example Values |
|---|---|---|---|
| Initial Convolutional Layer | Conv2d | Filters: 32, Kernel Size: (3, 3), Stride: (2, 2), Padding: (0, 0) | Filters: 32, Kernel Size: (3, 3), Stride: (2, 2), Padding: (0, 0) |
| Inception Modules (Modules 1–11) | Mixed (1x1, 3x3, 5x5) | Filters: 64, 128, 256, 512 | Filters: 64, 128, 256, 512 |
| Auxiliary Classifiers | Conv2d + FC | Filters: 128, FC Output Size: 1024, Dropout: 0.7 | Filters: 128, FC Output Size: 1024, Dropout: 0.7 |
| GA Pooling | Adaptive AvgPool2d | Size of Output: (1, 1) | Size of Output: (1, 1) |
| FC Layer | Linear | Size of Output: Number of Classes | Size of Output: Number of Classes |
The Inception V3 architecture is a more complex and advanced model designed to capture multiscale features from retinal fundus images, which is crucial for accurately detecting numerous levels of DR. The model is schematized by the Inception module, which employs multiple convolutional filters of different sizes (1x1, 3x3, 5x5) simultaneously, allowing the network to recognize features at various levels of granularity. The ReLU function follows each Inception module to highlight non-linearity, permitting the model to acquire complex patterns in the data. Batch normalization is applied to the output of the convolutions to ensure training stability and improve convergence. Inception V3 also adds an auxiliary to the intermediate process to solve the gradient vanishing problem and thus improve early learning. Table 4 displays the flexibility of Inception V3 model parameters. The architecture includes an output max pooling layer to downsample feature maps and decrease computational complexity while preserving important information for classification. The final output is produced by a fully connected process that classifies the input image into one of five DR groups. Inception V3 efficiently processes complex scales of retinal features, making it predominantly useful for DR classification.
| Layer | Type | Parameters | Example Values |
|---|---|---|---|
| VGG16 Convolutional Blocks | Conv2d | Number of Layers: 13, Filters: 64, 128, 256, 512 | Number of Layers: 13, Filters: 64, 128, 256, 512 |
| Inception V3 Modules | Mixed (1x1, 3x3, 5x5) | Filters: 64, 128, 256, 512 | Filters: 64, 128, 256, 512 |
| Concatenation Layer | Concat | Input: VGG16 + Inception V3 Feature Maps | Input: VGG16 + Inception V3 Feature Maps |
| GA Pooling | Adaptive AvgPool2d | Output Size: (1, 1) | Output Size: (1, 1) |
| FC Layer | Linear | Output Size: Number of Classes | Output Size: Number of Classes |
| Dropout | Dropout | Dropout Rate: 0.5 | Dropout Rate: 0.5 |
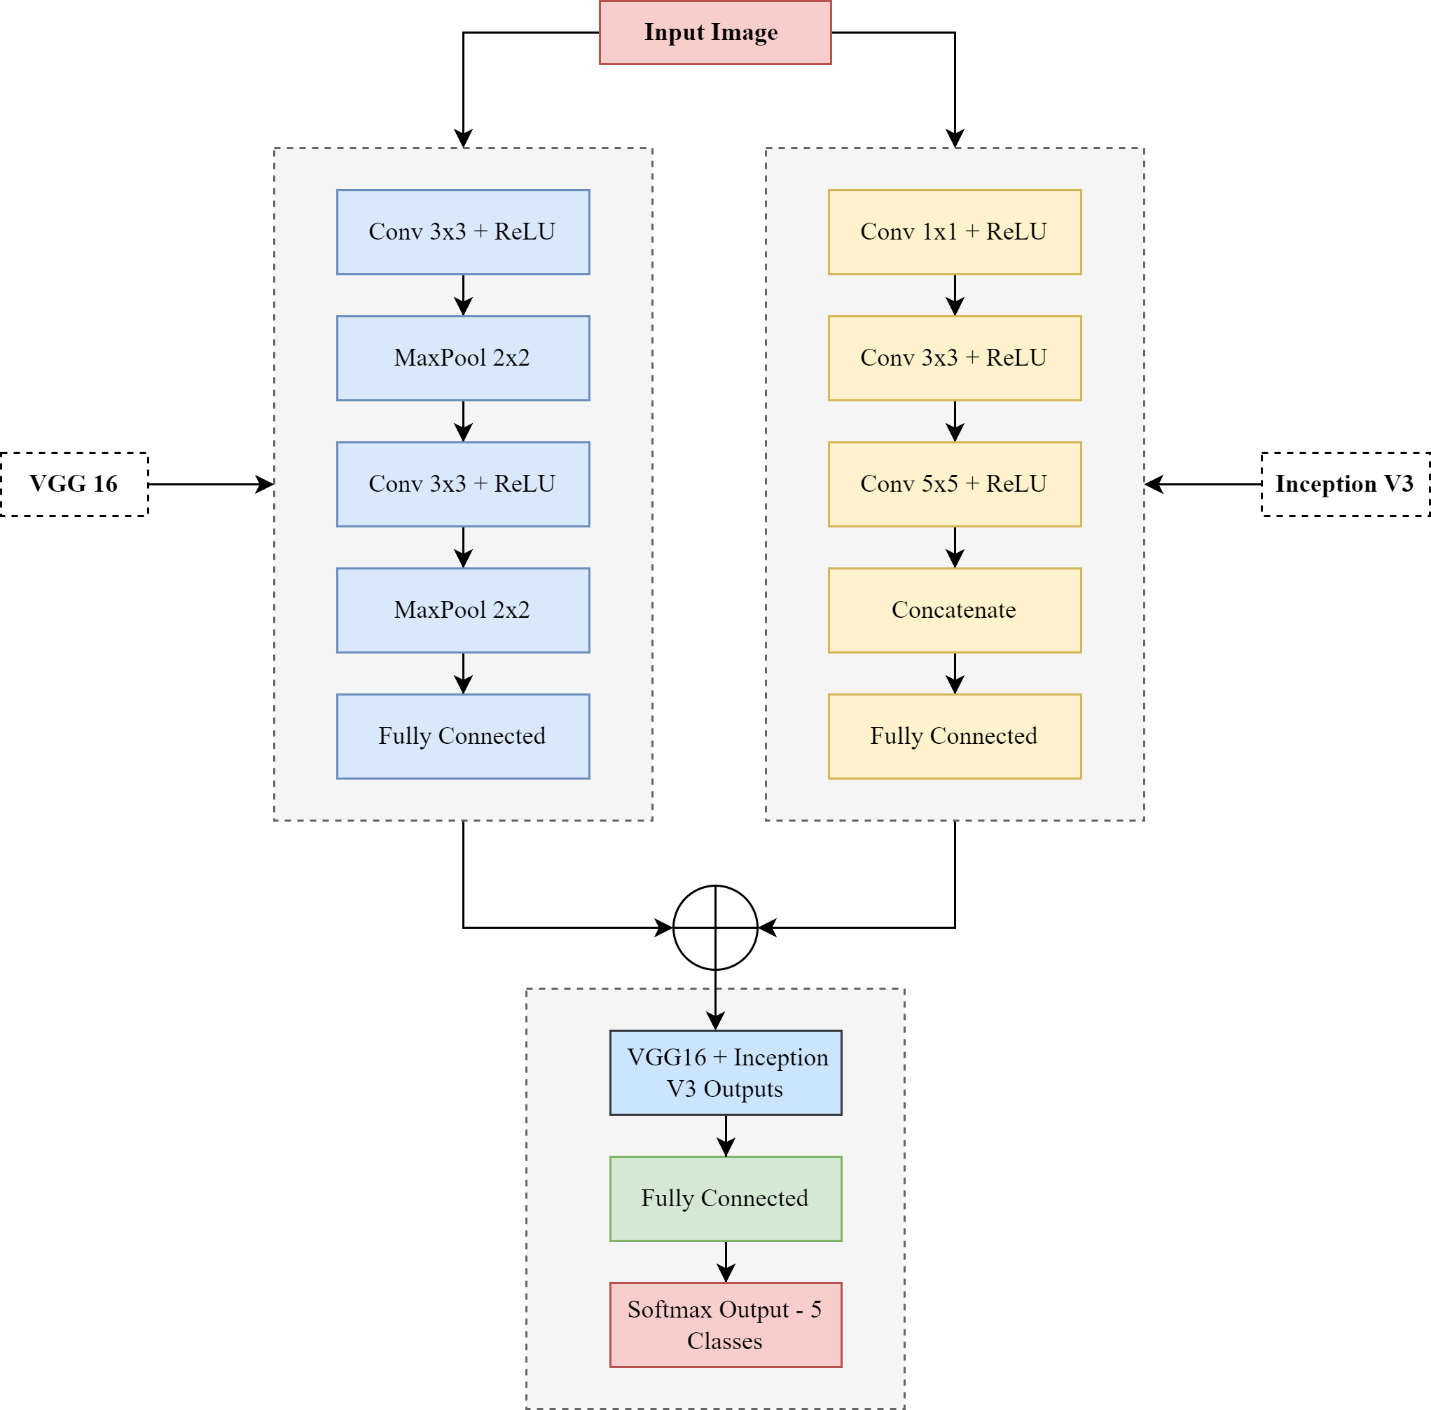
Our deep hybrid model integrates the power of CNN architectures to advance model performance and increase accuracy for diabetic retinopathy (DR) detection: the VGG16 and Inception V3 models. This hybrid approach first inputs pre-processed retinal fundus images independently of the VGG16 and Inception V3 networks. VGG16 is excellent at capturing fine details, such as texture and edges, which are essential for identifying early signs of DR. In contrast, the architecture of Inception V3 excels at analyzing multiple patterns and provides a broader context for analyzing more critical processes. After feature extraction, the outputs of the last convolutional layers of both architectures are combined to form a single feature layer by utilizing the advantages of the two CNN networks, classify the combined features into one of five DR weights, further improving the model's ability to expand widely across different datasets. Combining the fine-grained feature extraction capabilities of VGG16 with the multi-detection capabilities of Inception V3, the hybrid model outperforms all other models given more accurate and robust means to classify DR. Table 5 shows the parametric setting of our deep hybrid model. Figure 8 depicts the detailed architecture of our proposed model for DR detection.
We evaluate and analyze the performance of our proposed deep learning approach using different performance measuring metrics, including confusion matrix (CM), to evaluate the overall proposed model efficiency. The confusion matrix, an error matrix, is mainly helpful in evaluating classification models and determining the models [20]. CM can be defined as in equations.
The accuracy metric is the ratio of the sum of true positives (TP) and true negatives (TN) to the total number of TP, TN, FP, and FN, known as ACC.
The precision metric is defined as the ratio of true positives (TP) to the total number of predicted positive labels, including both true positives (TP) and false positives (FP), which mathematically is defined as.
However, recall measures how well a classification model detects positive examples in neural networks. Recall is the dataset's true positives (TP) ratio to positive instances, which is mathematically representative.
Finally, the F1-score is the harmonic mean of accuracy and recall, balancing model accuracy with accurate positive detection. The equation shows the F1 score.
| Dataset | Model | Accuracy | Precision | Recall | F1-Score |
| EyePACS1 | VGG16 | 0.9444 | 0.9450 | 0.9640 | 0.9544 |
| Inception V3 | 0.9404 | 0.9476 | 0.9479 | 0.9442 | |
| Hybrid | 0.9963 | 0.9951 | 0.9934 | 0.9908 | |
| APTOS2019 | VGG16 | 0.9395 | 0.9191 | 0.9546 | 0.9461 |
| Inception V3 | 0.8977 | 0.9159 | 0.9570 | 0.9446 | |
| Hybrid | 0.9870 | 0.9867 | 0.9924 | 0.9858 | |
| Note:Hybrid = VGG16 Inception V3 | |||||
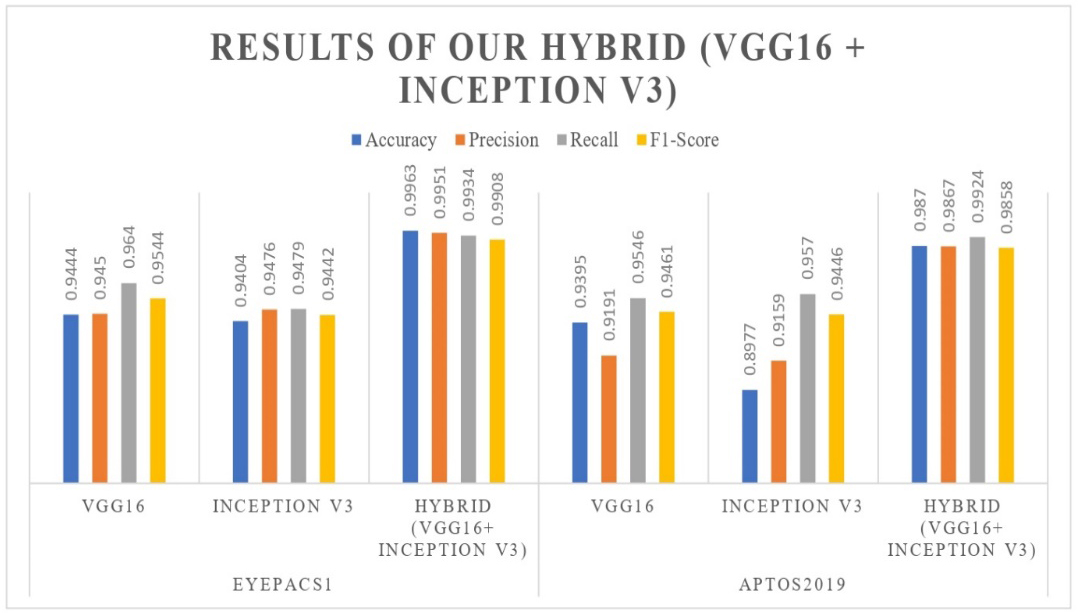
Our study provides an in-depth review of the performance and evaluation of our deep hybrid model in diagnosing diabetic retinopathy (DR). This novel model has been rigorously tested on various databases, including EyePACS1 and APTOS2019, to evaluate its robustness and performance. To assess the reliability and efficiency of our hybrid model, we compare its performance with the previous studies and methods, as shown in Table 7. A comprehensive analysis of results provides insight into the strengths and potential limitations of the deep hybrid model and provides detailed information about its potential. Our study uses various performance metrics to evaluate the model classification. Table 6 and Figure 9 show the results performance of our deep hybrid model on EyePACS1 and APTOS2019 datasets compared to models such as VGG16 and Inception V3.
| Reference | Model | Accuracy | Precision | Recall | F1-Score | ||||
|---|---|---|---|---|---|---|---|---|---|
| [31] | U-Net | 0.87 | 0.89 | 0.96 | 0.88 | ||||
| [32] | Inception V3 | 0.901 | 0.982 | 0.89 | 0.95 | ||||
| [33] | VGGNet | 0.803 | 0.855 | 0.82 | 0.98 | ||||
| [34] | AlexNet | 0.9680 | 0.87 | 0.87 | 0.86 | ||||
| [8] |
|
0.9137 | N/A | 0.9390 | 0.8634 | ||||
| [5] | KNN | 0.87 | 0.66 | 0.93 | N/A | ||||
| [35] | WP-CNN | 0.88 | 0.719 | 0.815 | N/A | ||||
|
|
0.9963 | 0.9951 | 0.9934 | 0.9908 | ||||
| 0.9870 | 0.9867 | 0.9924 | 0.9858 |
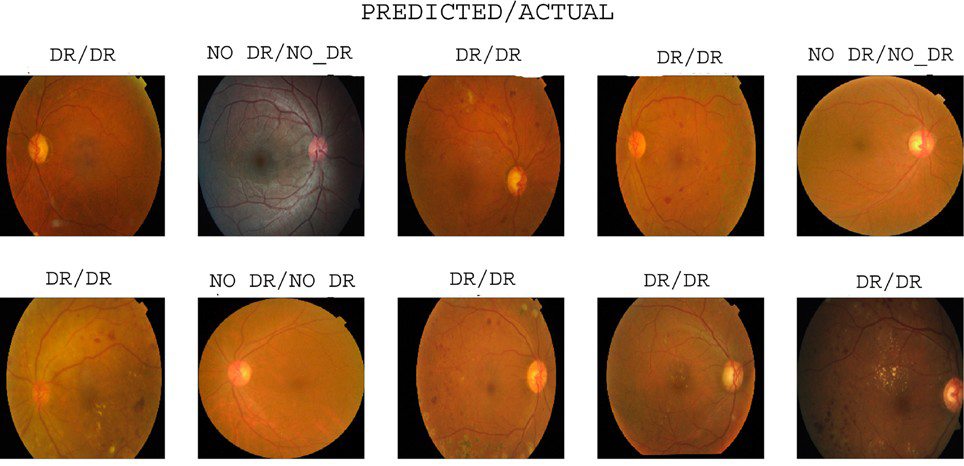
The VGG16 model achieved 0.9444 accuracy, 0.9450 precision, 0.9640 recall, and 0.9544 F1-score on the EyePACS1 dataset. Similarly, the Inception V3 model achieved 0.9404 accuracy, 0.9467 precision, 0.9479 recall, and 0.9442 F1-score. The hybrid model combines VGG16 and Inception V3 and outperforms both by achieving 0.9963 accuracy, 0.9951 precision, 0.9934 recall, and 0.9908 F1-score. Correlation confusion matrices [426, 25, 16, 313], [384, 24, 21, 351], and [535, 2, 4, 245] provide detailed information about the performance of the model in detecting and classifying diabetic retinopathy. The model prediction result is shown in Figure 10.
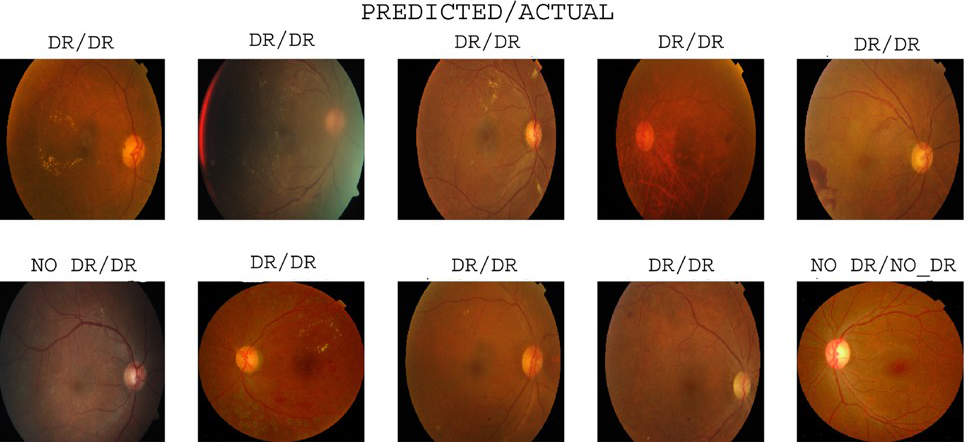
The VGG16 model achieved 0.9395 accuracy, 0.9191 precision, 0.9546 recall, and 0.9461 F1-score on the APTOS2019 dataset. Similarly, the Inception V3 model achieved 0.8977 accuracy, 0.9159 precision, 0.9570 recall, and 0.9446 F1-score. The hybrid model combines VGG16 and Inception V3 and outperforms both by achieving 0.9870 accuracy, 0.9867 precision, 0.9924 recall, and 0.9858 F1-score. Correlation confusion matrices [411, 32, 24, 327], [577, 54, 26, 137], and [584, 7, 10, 193] provide detailed information about the performance of the model in detecting and classifying diabetic retinopathy. The model prediction result is shown in Figure 11.
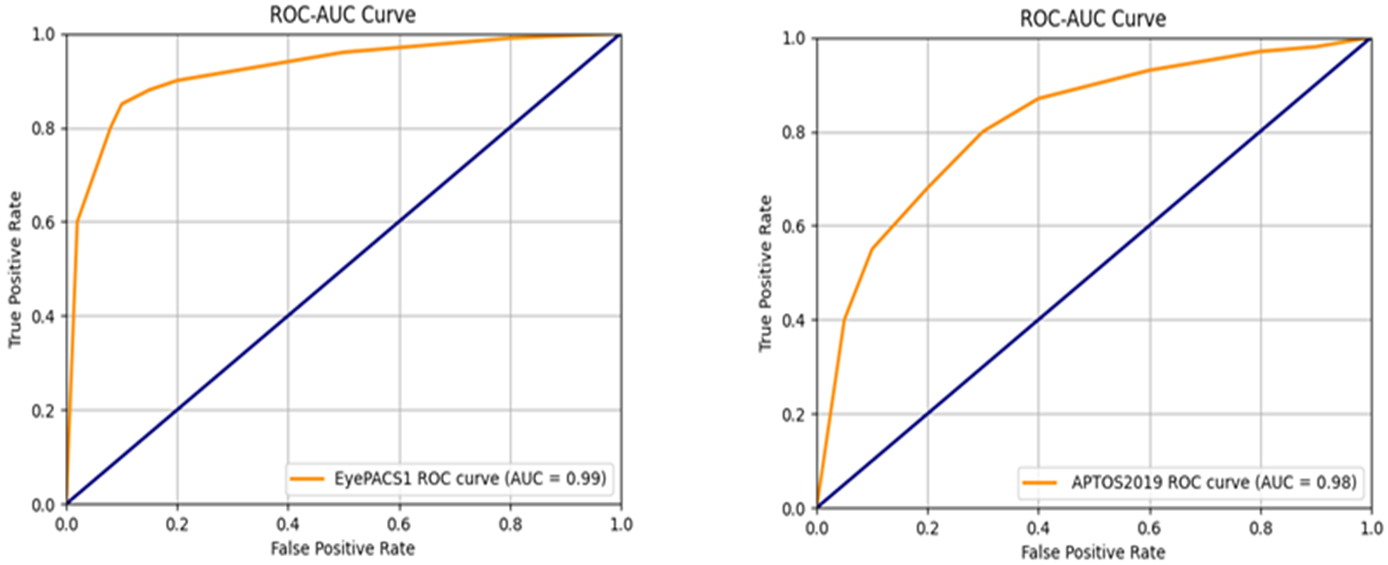
Moreover, we employ many performance-measuring metrics to assess and compare our combined model with prior state-of-the-art research studies conducted on diverse datasets. In Figure 12, the visual analysis displays a comparable ROC-AUC curve. Moreover, Table 6 comprehensively summarizes the model's performance on several datasets, including various measuring metrics. Furthermore, Table 7 compares our hybrid model performance findings with prior research studies to detect and diagnose diabetic retinopathy (DR). Our hybrid model, consisting of VGG16 and Inception V3, provided robust assessment performance on the APTOS2019 and EyePACS1 curated datasets, demonstrating promising results compared to state-of-the-art studies. Our deep hybrid model achieves a notable accuracy of 0.9963 on EyePACS1, demonstrating its effectiveness in categorizing diabetic retinopathy (DR).
Our research study significantly contributes to making an automatic and early detection diabetic retinopathy system by proposing a deep hybrid model that integrates the strengths of VGG16 and Inception V3 architectures. This combination enhances the accuracy and robustness of the detection method, particularly in distinguishing between the five stages of diabetic retinopathy: 'normal,' 'mild,' 'moderate,' 'severe,' and 'proliferative.' By leveraging the detailed feature extraction capabilities of VGG16 and the multiscale feature recognition power of Inception V3, our hybrid model addresses the challenges posed by varying retinal image characteristics. The model has been tested on two widely recognized datasets, APTOS2019 and EyePACS1, demonstrating its effectiveness in real-world applications. The detailed numerical results, which can be seen in Table 5, highlight the model's capabilities, with accuracy rates of 0.9963 on the EyePACS1 dataset and 0.9870 on the APTOS2019 dataset, along with high precision, Recall, and F1 scores. Compared to recent state-of-the-art models (as shown in Table 6), our hybrid model exhibits superior performance, underscoring its potential as a reliable tool for early and accurate diabetic retinopathy detection. However, it is essential to acknowledge the constraints of our model, such as how it depends on the quality and diversity of the training datasets, which might affect its ability to be applied consistently to other populations or imaging scenarios.
Limitations: Despite the strong performance of our deep hybrid model, there are several limitations. The model's effectiveness depends on the quality of input images, as poor-quality or low-resolution images may reduce diagnostic accuracy. The datasets used exhibit class imbalances, which could introduce bias, particularly for underrepresented classes. While the model performs well on EyePACS1 and APTOS2019, its generalizability to other datasets with different imaging protocols or demographics requires further validation. Additionally, the model's high computational complexity may limit scalability and deployment in resource-constrained environments.
Future Work: To augment the practicality of our model, we suggest conducting a future study that explicitly targets tasks related to these datasets and refines the hybrid model to achieve better performance in real-world scenarios. Future studies could evaluate the model's performance under different conditions and datasets and explore the integration of new advanced features or architectures. Additionally, while data augmentation and preprocessing techniques have shown improvements in model accuracy and generalizability, a direct comparison between the model's performance on augmented and non-augmented data was not performed in this study. As part of future work, we plan to conduct a comprehensive evaluation to assess how data augmentation reduces overfitting and enhances model robustness, providing further insights into its impact on the model's performance.
 Copyright © 2024 by the Author(s). Published by Institute of Emerging and Computer Engineers. This article is an open access article distributed under the terms and conditions of the Creative Commons Attribution (CC BY) license (https://creativecommons.org/licenses/by/4.0/), which permits use, sharing, adaptation, distribution and reproduction in any medium or format, as long as you give appropriate credit to the original author(s) and the source, provide a link to the Creative Commons licence, and indicate if changes were made.
 IECE Transactions on Emerging Topics in Artificial Intelligence
ISSN: 3066-1676 (Online) | ISSN: 3066-1668 (Print)
Email: [email protected]

Portico
All published articles are preserved here permanently:
https://www.portico.org/publishers/iece/