

IECE Transactions on Social Statistics and Computing
ISSN: 2996-8488 (Online)
Email: [email protected]

Deep learning and machine learning have shown massive success across a diverse array of domains, including image processing [1, 2, 3, 4, 5, 6, 7], natural language processing (NLP) [8, 9, 10, 11], and audio processing [12, 13, 14, 15]. Deep learning for energy consumption is remained unexplored. In this modern world, energy consumption is increasing by the second so much so that there is a need for sustainable utilization [16]. With increasing population, the demand for housing has reached its peak. Several policies are formulated to address the environmental concerns raised due to direct or indirect emissions by buildings [17]. To formulate strategic planning initiatives for sustainable and efficient energy utilisation, the European Union has established a legislative infrastructure using Energy Performance of Buildings Directive (EPBD). With growing carbon emissions there is a need to build more energy efficient homes ans well as formulate long-term renovation strategies to improve the energy efficiency of existing buildings [18, 19, 20]. All dwellings are mandated to be assessed and evaluated for their energy consumption based on their properties like geometry of the building(Apartment, Mansion, semi detached house, detached house), wall insulation, occupant's behavior, cooling or heating systems in place and weather conditions of the area [21, 22, 23]. Energy Performance Certificate(EPC) termed as Building Energy Rating (BER) in Ireland classifies the dwellings into 15 categories ranging from A1, A2, A3,..G with A1 rating being the desired and most efficient. The planers aim to upgrade homes to a minimum of B2 rating in the next few years in order to minimise and control the carbon emissions.
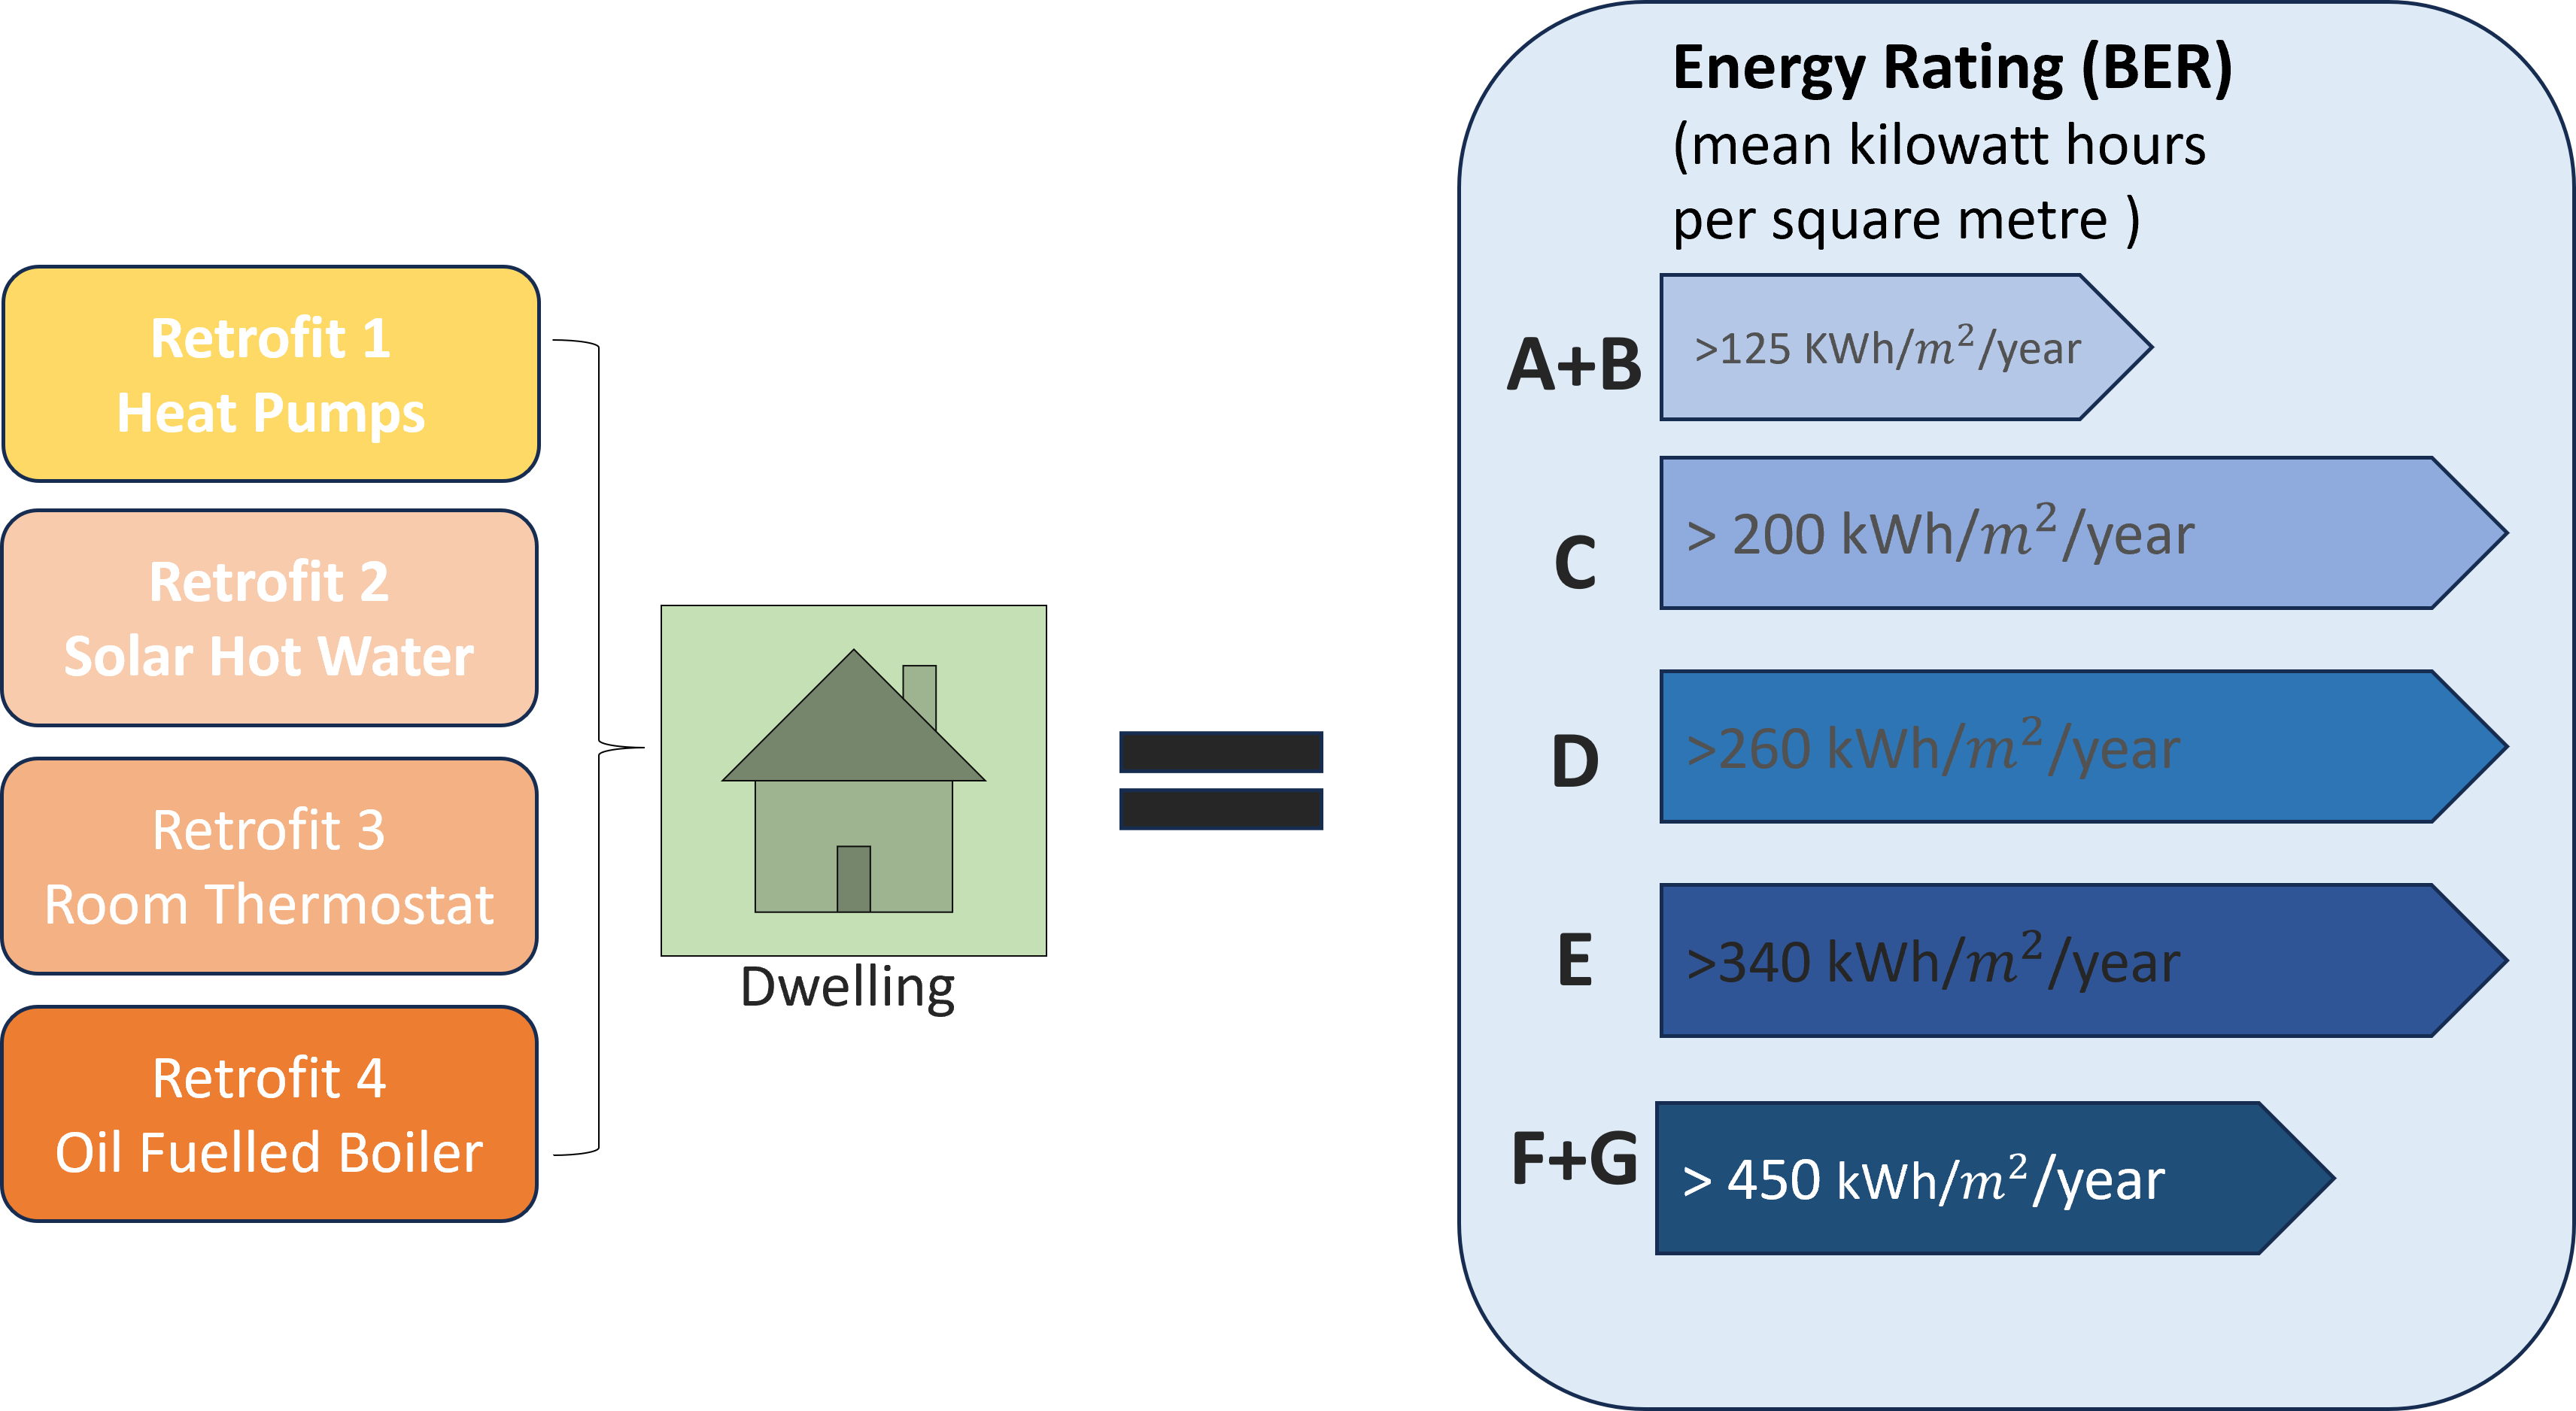
Research Background : What is BER11 and how is it an indication of energy performance for a building? A BER measures a house's energy performance in kWh/m²/year, but the actual performance depends on how the occupants use the home. It excludes electricity used for cooking, refrigeration, laundry, and appliances. BER assessments, conducted by trained and Sustainable Energy Authority of Ireland(SEAI) 22-registered assessors, ensure accurate data entry into SEAI-approved software.
Research Motivation: To mitigate problems faced by citizens who spend a lot of resources to heat cold damp and unhealthy spaces policies like the Deep retrofit Programme 33 has helped upgrade houses as old as 100 years to A rating [24, 25]. Using data driven Machine Learning approach to understand the dependent features used for calculating the BER of a dwelling provides a scope to simplify the process of upgrading the energy ratings and thus reduce carbon emissions. This approach would reveal complex relationships between features of the dwelling and thus eliminate them to make the process of assessment simpler and interpret-able [26, 27].
Research Objectives: Research Question: To what extent Machine learning algorithms can be applied to analyse energy utilization for domestic buildings in Ireland based on their BER (Building Energy Rating) and the impacts of Retrofit Interventions proposed? This research will focus on achieving the following objectives shown in Figure 1:
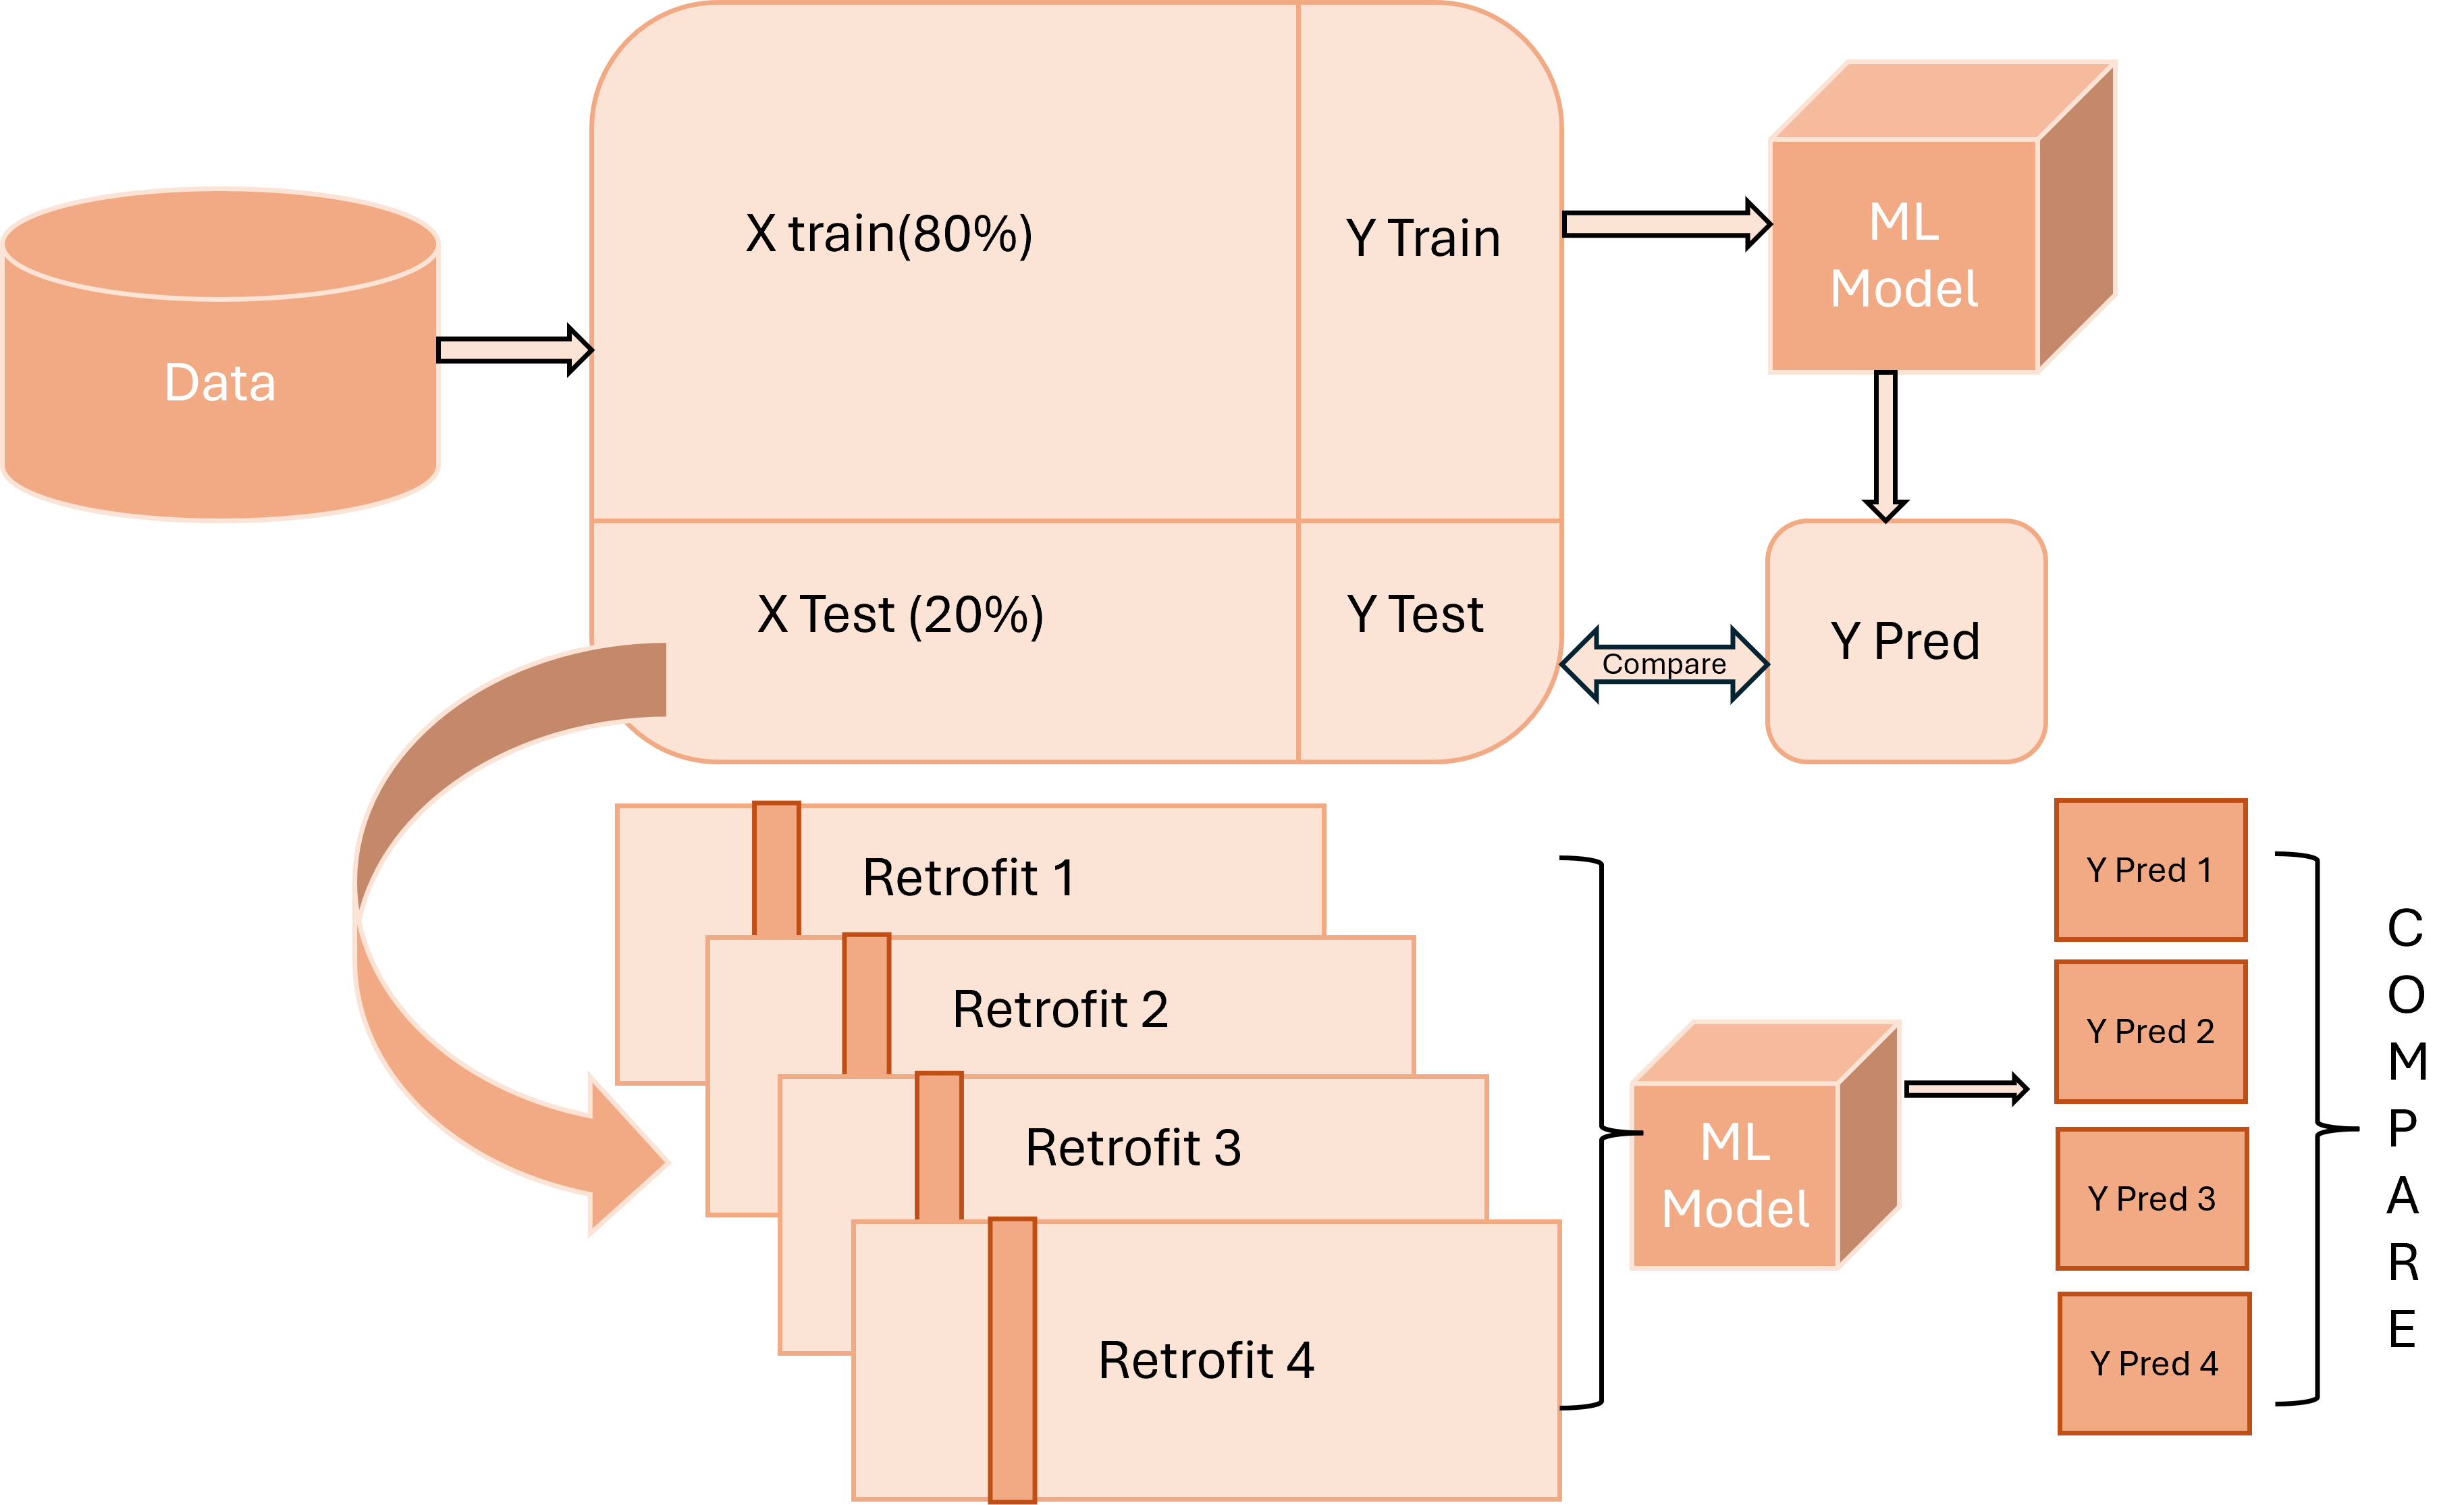
This research provides a novel study of the impact that retrofit interventions provide on energy performance for domestic buildings in Ireland. This is done using predictive machine learning models, specifically used for classification problems. As shown in Figure 2 the implementation design of the model is depicted. The pre-processed data after cleaning and transforming is split into train and test. The machine learning model is trained on the trained data set and then used to predict the values for the test data set. The experiments performed on the test data set are independent of each other. The research uses python and its various libraries for implementing the model and experiments. To run these experiments, Google Collabs was used for faster processing of the code. All the code artefact was formulated in a Jupiter notebook for easy reproduciblity.
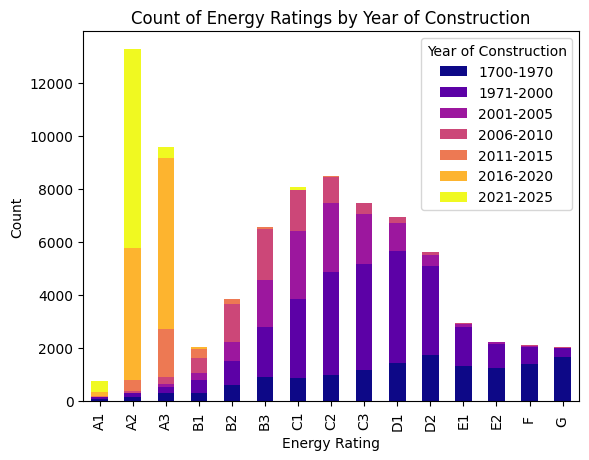
Exploratory Data Analysis-Initial data visualisation performed on the dataset showed the Rating distribution over the years as depicted in Figure 3. It can be identified that dwellings with BER C3 and below, were constructed before 2010. Dwellings constructed in the following years were more energy efficient. It can also be seen that some dwellings even though constructed in 1700-1970s range, possess BER of A1. This shows that some retrofit changes must have been made in order to improve the energy efficiency and hence the BER.
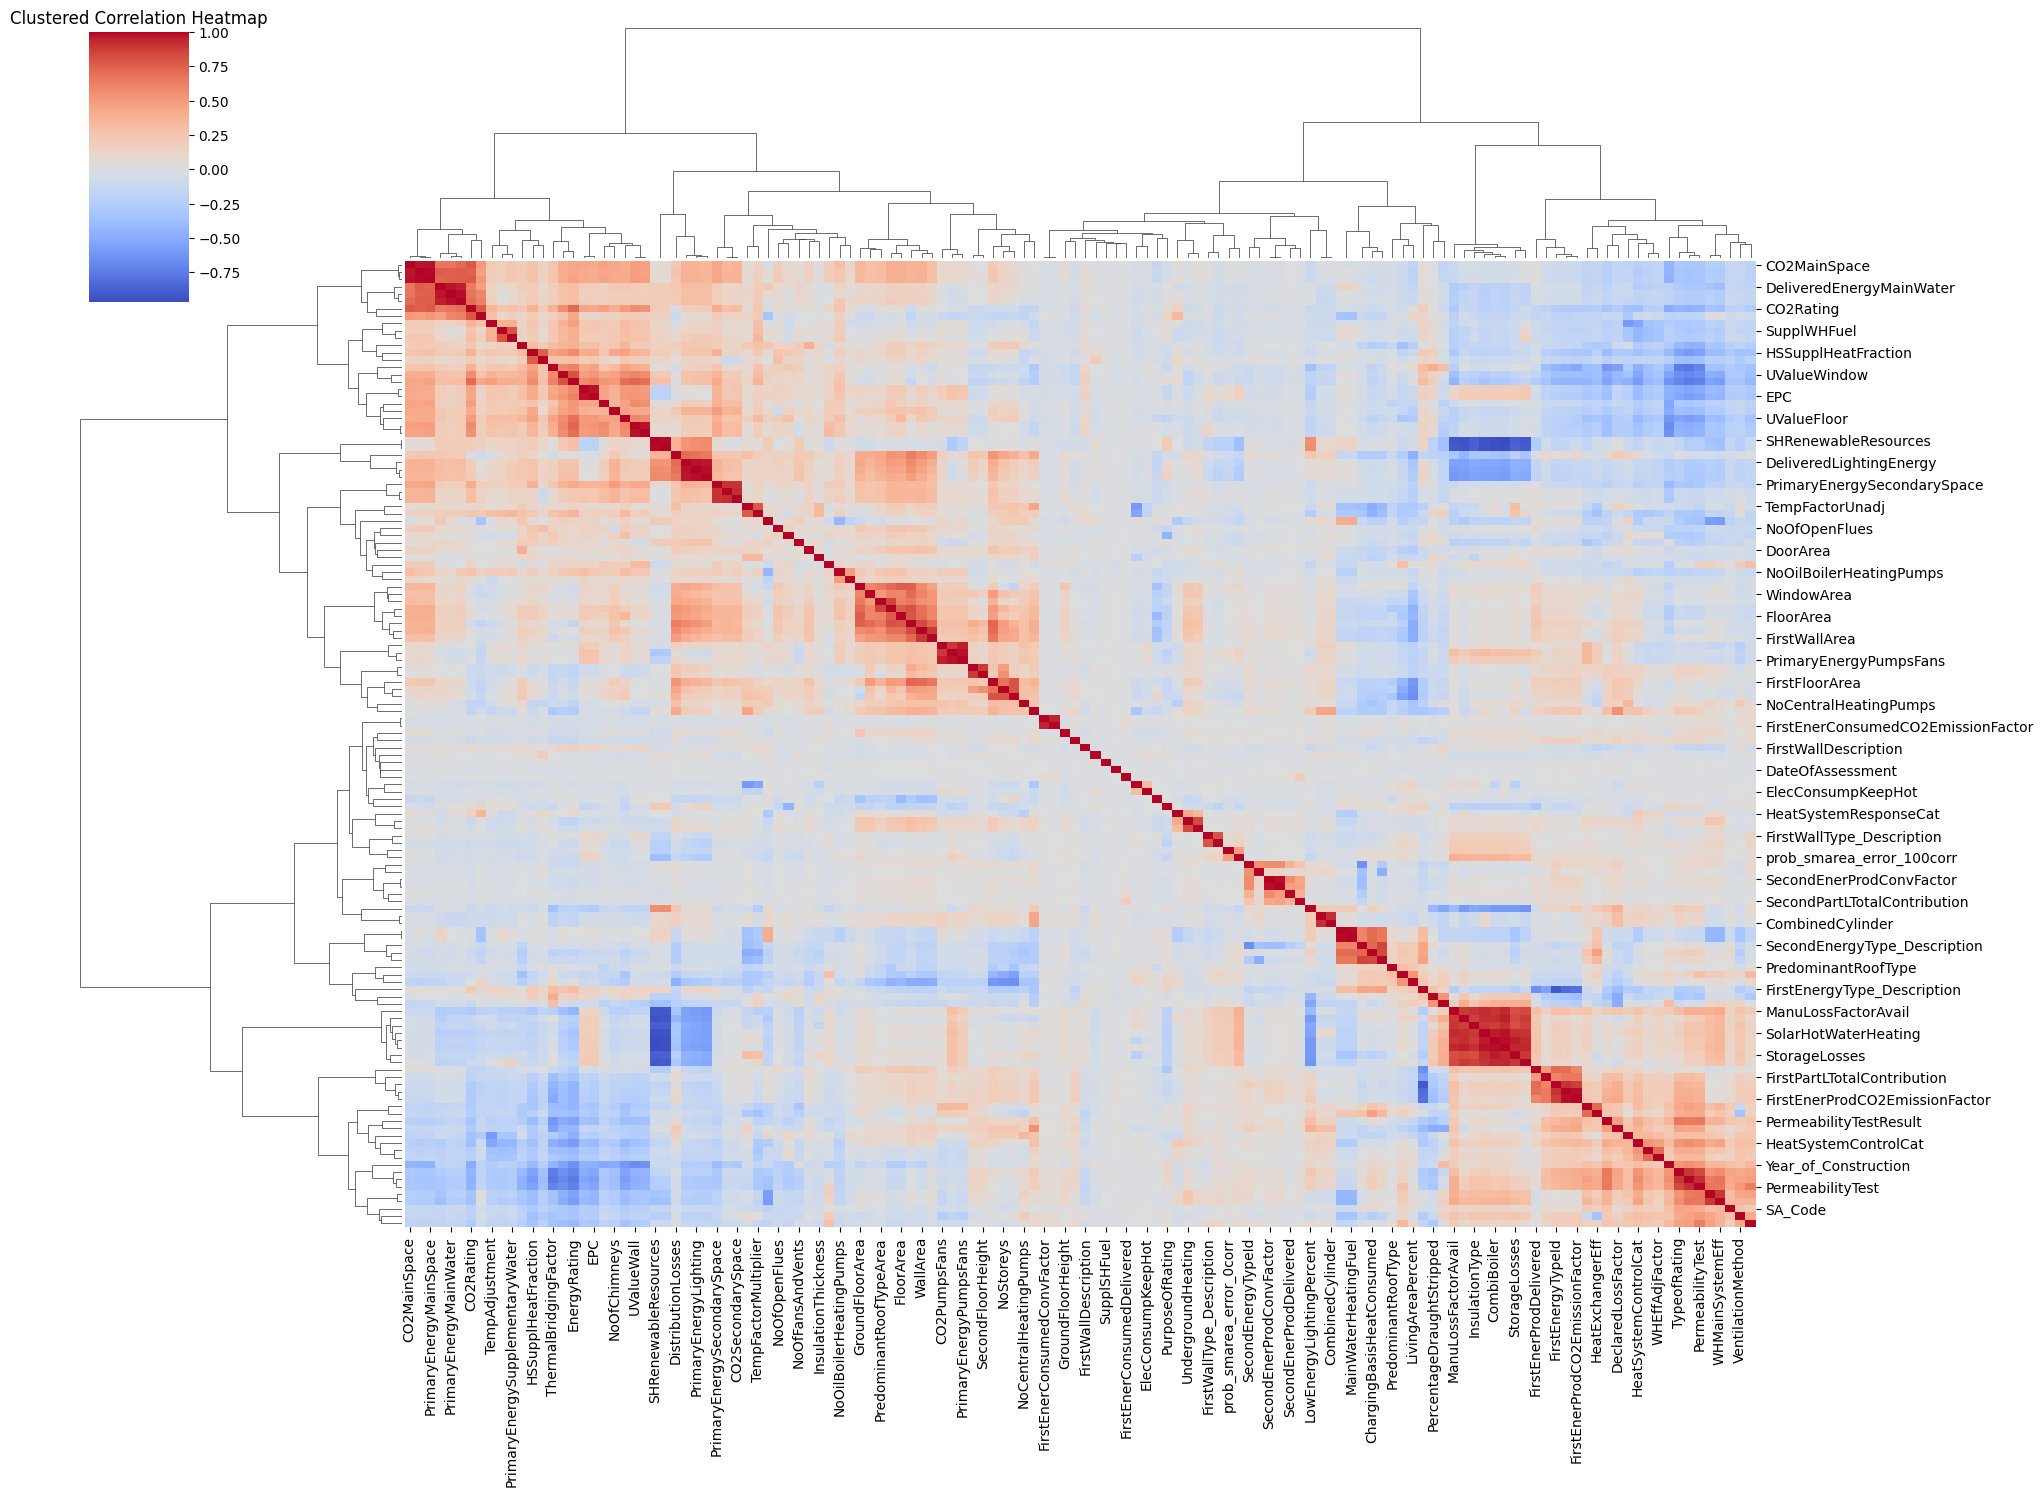
Correlation Matrix shows the relation between the features of the dataset. The features are not always independent of each other. They are related to each other in some way. The co-relation between the features can be analysed by plotting a clustered correlation matrix of the features as shown in Figure 4. The plot shows blue color representing negative correlations, red representing positive correlations, and white indicating near-zero correlations.The tree division on the left side shows how the features are clustered based on their correlations. As inferred, "CO2Rating" and "CO2MainSpace" show a dark red square, it means they are highly positively correlated. Similarily "SHRenewableResources" and "StorageLosses" are highly negatively correlated. This heatmap helped in data exploration and feature selection.
The work done in this field of research is notable and has improved the decision making process of urban planners. Data driven models have proved out to be of great use in understanding the data and infer insights useful for decision making. BER assesment and certification is still considered as a bureaucratic mandate. The retrofit upgrades are not sincerely considered by users due to mistrust in the BER assessment process. This process involves assuming default values for calculation based on the dwelling type and is not always true to the real world scenario. BER is just an indicative value and does not provide an actual energy consumption metric. Machine Learning tackles these issues by i.) Reducing Dimensions for easy input interpretation ii.) Identify faults, improve and control BER assessment process.
Research done using a data driven approach for predicting energy ratings focusing on reducing dimensions has benefited field the most. Balanced accuracy along with model simplicity was achieved by [22]. The accuracy was moderate however the complexity was reduced to quite an extent. The novel model QLattice was implemented to achieve high accuracy with the main aim of striking transparency and accountability of decisions taken by the algorithms. This methodology was proposed to be integrated with Explainable AI to enable the end user understand and control the decision making process. By reducing the input dimensions and making the model simpler to use, the research reinstated that ML is efficiently used for predictive problems using lesser features. [28] also developed a regression model implementing ANN by simplifying the input features for users. The authors used only 12 features for energy rating prediction and thus made the process usable by the end user with less domain knowledge.Some studies have also been done by using synthetically generated data for building stock. [19], highlighted in their research the need for substantial quality data to understand the role of various parameters in predicting the energy rating. [20], formulated synthetic data generator that uses only 19 input features. The issues with finding the right data can be resolved by using synthetic data for energy performance analysis. However, this data cannot be validated with the real world scenarios but it is useful for carrying out any research in the similar field The researchers used J and energy tools for generating synthetic building stock.Other similar studies done by [23], [29] and [30], translate the efficiency of ML models in predicting energy ratings with reduced features than used for actual derivation of the rating. The first author applied statistical techniques on building stock data for Estonia and focused on understanding zero energy utilisation for domestic buildings We will stop the model achieved an accuracy of 73 percent but it was mostly dependent on the historical energy performance certificate data of European countries. Miller, however, used explainable machine learning and focused mainly on non residential smart meter data for classification of energy ratings. The author used temporal feature engineering for identifying the key features for breeding classification.An interesting insight provided by a [27] into the behavioural impact on energy rating by occupants Helped in extending the use of machine learning models predicting energy ratings. The author also analysed and provided criticism on the assumptions made by DEAP Software used for the calculation of energy ratings. Another different use case for machine learning models in predicting energy ratings for detection of data corruption in energy ratings are calculated using default values of building properties the authors [25] detected abnormalities in the data for similar features of the dwelling They were awarded different energy ratings. This study was performed on Irish BER data and questioned the data integrity of BER assessment process.
Studies that extend the use of machine learning models for prediction of energy ratings into understanding and analysing retrofits solutions for domestic buildings Help urban planners build energy efficient homes and reduce carbon emissions. The [31] combines machine learning model with multi objective optimization in a large data set. The study demonstrates significant energy savings and return on investments. The objectors formulated in this study include minimising the energy consumption of a building and maximising the cost savings for retrofit solutions based on building parameters that could be modified in an existing building. The [32] use a novel combination of ELM and shell game optimization focusing on smart metering data collected from European countries The machine learning models Used in the research like ANN provide moderate accuracy as the main objective of lies in understanding the impact of retrofit solutions on energy efficiency.The [26] estimates the effect on property sale and rental prices based on the energy rating of the dwelling. The study uses mathematical and statistical tools to determine the effect of energy efficient homes on property values. [17], Discusses the inter-building energy dynamics and inter-dependencies of adjacent buildings on the energy efficiency. The research focuses on a data driven machine learning model that uses simulation to understand the energy consumption of single building, community building urban and rural buildings providing valuable insights for building design stage and policy formulation for urban energy efficiency for a sustainable future.
This study proposes the modelling of a Machine Learning algorithm that predicts the Energy Rating of houses in county Dublin, Ireland. This research aims to identify the best retrofit solution that improves the energy efficiency of various dwelling types using data driven approaches. The steps involved in the process can be categorised and are discussed in this section. This section also discusses the decisions made during the implementation stage of the research.
| Features | Description |
|---|---|
| County Name, Type of dwelling (Apartment, Mansion etc.), Year of Construction, Storeys, Vents, and Lobby | Properties that define the dwelling. |
| U Values for Wall, Roof, Floor, Door, and Window | Physically derived thermal properties of building components. |
| Area in square meters for Floor, Wall, Roof, Door, and Windows | Geometric properties of the dwelling. |
| Main Space Heating Fuel, Main Water Heating Fuel | Oil, Gas, or Electricity used for Space and Water heating. |
Analysing any data and gathering insights from it largely depends on how the data was collected, organised and stored for the process. The Building Stock data for Ireland published by Sustainable Energy Authority of Ireland (SEAI) 44 This data is published every quarter and is a part of the BER Research Tool available for public use. The essence of the dataset is tabulated in Table 1. Along with these columns, there are in total 211 features in the dataset. The research focuses only on building stock for county Dublin that gives substantial data of 82 thousand dwellings for analysis and prediction. The data used has values for building stock from years 1700 to 2024.The data used for this research has 82,030 rows and 211 columns. The data can be divided into:
Dependent/Target Variable: Energy Rating
Independent Variables: Building Stock (Dwelling Properties, Geometric properties etc.)
As mentioned in Table 1 these features are used to mathematically calculate the BER for each dwelling using DEAP(Dwelling Energy Assessment Procedure) software55 This research aims to predict the value of BER based on the features of building stock using a data driven approach.
Data Cleaning stage comprises of understanding the quality of data and its form based on planned implementation. It involves checking for inconsistency in the dataset. Checking if there are missing or invalid values in the data helps in making the data ready for analysis. The dataset used was large and mostly clean. However, there were some columns that had missing values or null values. Some columns were not relevant to this study. Data cleaning was performed in two ways:
Domain Knowledge Feature Selection- Few columns that were not relevant to this research were removed from the dataset. Columns that were similar to the Energy Rating like the score of BER was removed. Columns like Co2 ratings and other Co2 emission features were removed as they would affect the future experiments in the project. This was done based on the electrical domain knowledge of the researcher.
Handling Missing Values- These columns were identified through code by calculating the missing percentage of data in each column. A decision was made to drop the columns that were 50 percent empty. The missing or null values for the remaining features were manipulated and filled. Missing values for numerical columns were substituted by the mean of that column. Missing values for categorical columns were substituted by the mode of that column. These substitutions were done by grouping the values for each dwelling type.
After removing the features using domain knowledge, 161 features were analysed for missing values. On dropping features with more than 50 percent missing values, 121 features remained. They were further analysed and visualised to take appropriate actions.
The Data is not used as it is for Machine Learning and processing. The dataset includes features with varied data types and values. For dimensionality reduction, there are various techniques that select important features that impact the Energy Rating most. Feature Importance analysis like Random Forest, Decision Tree Classifier are applied to decide the relevant features in the dataset. This process has a major contribution to the accuracy of the model and its prediction. For understanding variance in the data, PCA or Principal Component Analysis is performed. The dataset is reduced to its first two principal components (PC1 and PC2) that are independent of each other.
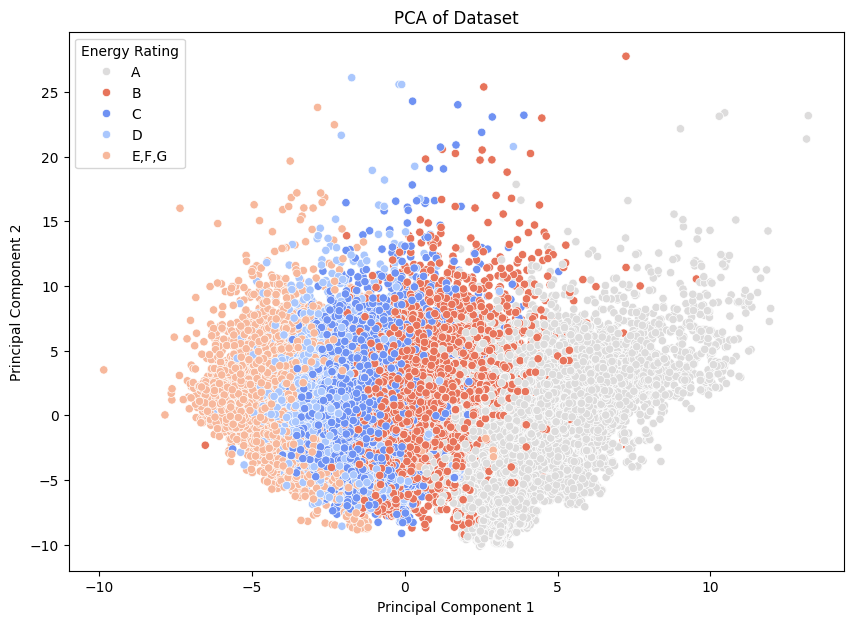
Figure 5 shows the scattered distribution of different BERs for each dwelling in the dataset against the Principal components identified by PCA. There seems to be a noticeable separation between the different energy ratings, like between 'A' and 'E/F/G'. This separation suggests that the PCA has successfully captured the differences in the dataset's features and it distinguishes high energy ratings (like 'A') from lower ones (like 'E/F/G'). The overlap between the ratings, especially between 'B' and 'C', or 'C' and 'D'. It suggests that there is some similarity in the features of the building stock. The plot shows that the ratings are not linearly separable and overlap in the feature space.
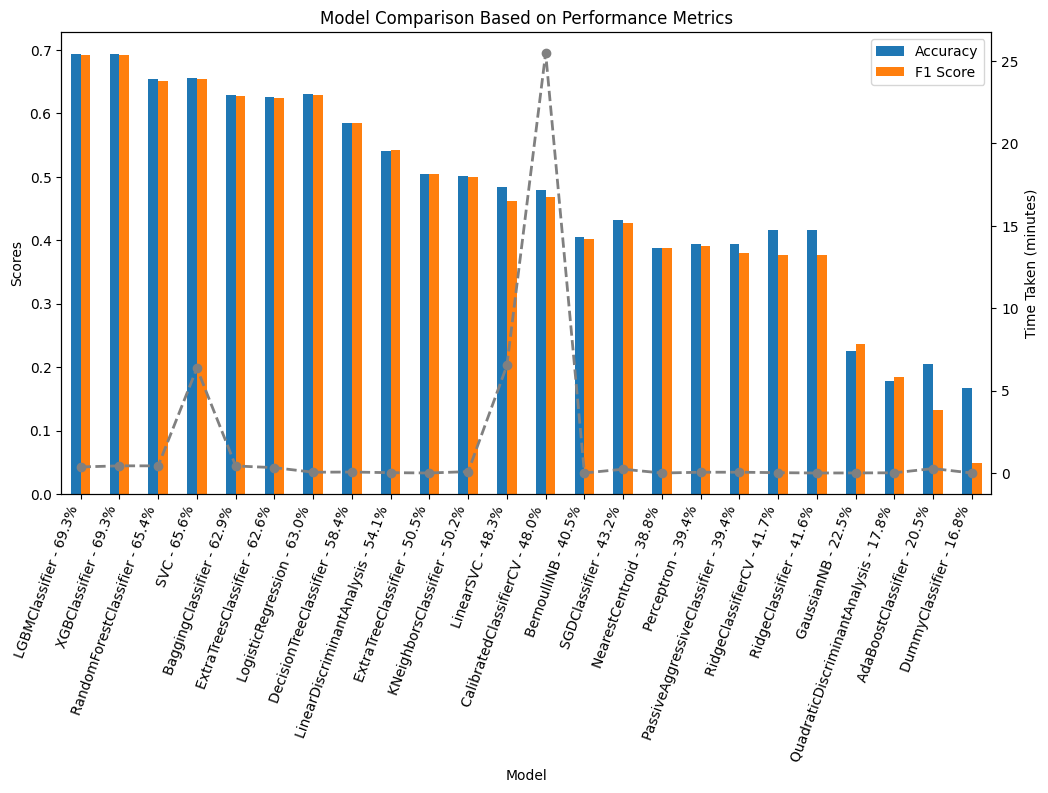
The aim of the research is to compute a machine learning model that predicts the BER for a dwelling based on the features present in the dataset. In this study, several models are applied to predict and classify the Energy ratings of the dwellings based on the features present in the data set. This study adopts the sample technique for data splitting by dividing the training and test data sets in a ratio of 80 and 20 with a random state of 42. There are many various techniques that could be used for dividing the data set into these two subsets to ensure that the division is made purely random. Many researchers like [20] use cross validation or K Fold for data splitting. As the focus of this research is on studying the impact of the retrofit solutions and not on the basic modelling and hence this data splitting is suitable for the research.This research uses LazyPredict library of Python that applies 25 Machine Learning Classifier Models and concludes with the accuracy and other metrics for each model. This helps in identifying the best model suitable for the dataset in hand. Figure 6 shows the metrics of all the models implemented on the dataset. LightGBM (Light Gradient Boosting Machine) classifier turned out to be the best performing model in terms of accuracy and F1 Scores.
| Feature Count | Accuracy Percentage | Feature Selection |
|---|---|---|
| 132 | 98 | No Domain Knowledge, Dropped features with more than 1 percent missing values |
| 49 | 79 | No Domain Knowledge, Dropped all Features with Missing Value |
| 101 | 69 | Domain Knowledge used, Dropped features with more than 50 percent missing values |
| 107 | 62 | Domain Knowledge used, Dropped features with more than 80 percent missing values |
CRISP-DM is an iterative process, where modifications can be made to check any improvements in the result. Four combinations were performed to check the best conditions that fulfill both research objectives. As this research focused on the retrofit solutions as well, feature selection was an important step in order to achieve desired impact on the energy rating. The Table 2 shows that even though the accuracy obtained while using 132 features was the maximum at 98 percent, implementation of experiments would have been affected. The feature selection process in this iteration did not include domain knowledge which would be useful in identifying features that are related to experimental features. After performing all possible scenarios, modelling was done by selecting features using Domain knowledge based on experiments to be performed and dropping columns that 50 percent empty.
The second part of this research aims to experiment retrofit changes in existing dwelling features and analyse the impact of these changes. If these changes help in improving the energy ratings, these could be used by dwellers to improve the energy efficiency of their dwellings. Following are the experiments made on the Test Dataset:
Retrofit 1: Install Heat Pumps in dwellings with no heat pumps for space heating. Value of NoCentralHeatingPumps was modified to 1 for rows in the dataset that had 0 for this feature. 1584 dwellings were impacted by this Retrofit.
Retrofit 2: Installing Solar Water heating system in dwellings that do not use it. Value of SolarHotWaterHeating was modified to 1 from 0 indicating Yes for presence of Solar Hot water heating system. This feature was modified for 784 dwellings.
Retrofit 3: Enabling the boiler to be controlled by a thermostat. If the boiler is controlled by a room thermostat the pumps will run less and therefore consume less electricity. Value for CHBoilerThermostatControlled was modified to 1 impacting 5812 dwellings.
Retrofit 4: Enabling the Oil boiler to be controlled by room thermostat and save energy. Value for OBBoilerThermostatControlled was modified to 1 from 0 impacting 685 dwellings.
The various models applied to the data set are then compared with each other based on the accuracies, balance accuracies, ROC AUC, F1 Score and the time taken. The accuracy calculated for each model is the difference between the predicted value calculated by the model and the actual truth value of the test data set.The formula for F1 Score is:
where:
The formula for Accuracy is:
In this research, retrofit solutions are implemented as experiments. Features such as heat pumps, solar water heat pumps, heat control systems, etc, are modified independently as different experiments. The machine learning model selected as the best performing model is then used to predict the energy rating of these individual experiments. The ratings predicted by the model are then compared with each other to see if they are significantly different from each other. If the predicted values for each energy rating are significantly different for each experiment then it can be concluded that the changes or the retrofit solutions made to the data set impacted the rating positively. To evaluate the performance of the experiments and to test the hypothesis one way ANNOVA and T tests are used. The F statistics and the P values are then analysed to conclude the findings.
The second part of this research aims to experiment retrofit changes in existing dwelling features and analyse the impact of these changes. If these changes help in improving the energy ratings, these could be used by dwellers to improve the energy efficiency of their dwellings. Following are the experiments made on the Test Dataset:
Retrofit 1: Install Heat Pumps in dwellings with no heat pumps for space heating. Value of NoCentralHeatingPumps was modified to 1 for rows in the dataset that had 0 for this feature. 1584 dwellings were impacted by this Retrofit.
Retrofit 2: Installing Solar Water heating system in dwellings that do not use it. Value of SolarHotWaterHeating was modified to 1 from 0 indicating Yes for presence of Solar Hot water heating system. This feature was modified for 784 dwellings.
Retrofit 3: Enabling the boiler to be controlled by a thermostat. If the boiler is controlled by a room thermostat the pumps will run less and therefore consume less electricity. Value for CHBoilerThermostatControlled was modified to 1 impacting 5812 dwellings.
Retrofit 4: Enabling the Oil boiler to be controlled by room thermostat and save energy. Value for OBBoilerThermostatControlled was modified to 1 from 0 impacting 685 dwellings.
Evaluation of the applied Machine Learning Models is shown in Table 8. It indicates that LGBMClassifier performed the best in terms of accuracy, ROC AUC value and F1 Score. The first part of the research question is answered by these results. Based on the selected features used for training the model, 69 percent accuracy was achieved. Results for LGBM Classifier model were good enough to proceed with the future experimentation. The ROC values indicate that LGBM was successful in classifying each class with good precision. Table 3 shows the classification Report for LGBM model used for Energy Rating prediction.
| Rating (A1-G) | Precision | Recall | F1 Score | Support |
|---|---|---|---|---|
| 0 | 0.98 | 0.98 | 0.98 | 131 |
| 1 | 0.99 | 0.99 | 0.99 | 2753 |
| 2 | 0.97 | 0.97 | 0.97 | 1862 |
| 3 | 0.82 | 0.75 | 0.78 | 406 |
| 4 | 0.73 | 0.72 | 0.73 | 783 |
| 5 | 0.68 | 0.70 | 0.69 | 1328 |
| 6 | 0.61 | 0.63 | 0.62 | 1659 |
| 7 | 0.55 | 0.56 | 0.56 | 1644 |
| 8 | 0.53 | 0.49 | 0.51 | 1522 |
| 9 | 0.50 | 0.54 | 0.52 | 1397 |
| 10 | 0.50 | 0.58 | 0.54 | 1113 |
| 11 | 0.43 | 0.29 | 0.35 | 595 |
| 12 | 0.40 | 0.39 | 0.40 | 418 |
| 13 | 0.52 | 0.50 | 0.51 | 399 |
| 14 | 0.78 | 0.75 | 0.76 | 396 |
As discussed in previous sections, the aim is to upgrade the dwellings to a minimum of B2 energy Rating. Therefore, an improvement in energy rating is considered if the count of dwellings ranging from A1 to B2 are increased as compared to the existing ratings.
Installing Heat Pumps in dwellings with no Heat Pumps was a retrofit that should improve the energy rating of the building. However, the count of dwellings whose energy rating improved was just 1 as seen in Table 4. For other impacted dwellings, the rating either did not improve or it was degraded to a lower rating. This however could have been due to other factors like dependency of Heat Pump installation on other features in the dataset.
| Rating (A1-G) | True Count | Predicted Count |
|---|---|---|
| 2 | 1862 | 1863 |
| 5 | 1328 | 1362 |
| 6 | 1659 | 1716 |
| 7 | 1644 | 1659 |
| 9 | 1397 | 1499 |
| 10 | 1113 | 1296 |
Installing Solar Hot Water system in dwellings with no Heat Pumps was a retrofit that should improve the energy rating of the building. However, the count of dwellings whose energy rating improved was 29 as seen in Table 5. For other impacted dwellings, the rating either did not improve or it was degraded to a lower rating. This however could have been due to other factors like dependency of Solar Hot Water system installation on other features in the dataset.
| Rating (A1-G) | True Count | Predicted Count |
|---|---|---|
| 2 | 1862 | 1865 |
| 4 | 783 | 809 |
| 5 | 1328 | 1362 |
| 6 | 1659 | 1709 |
| 9 | 1397 | 1443 |
| 10 | 1113 | 1296 |
Enabling Central space heating Boilers fueled by Gas with a room thermostat, saves energy consumption by regulating the heat based on the room temperature. This should improve the energy rating of the dwelling. However, the count of dwellings whose energy rating improved was just 1 as seen in Table 6. For other impacted dwellings, the rating either did not improve or it was degraded to a lower rating. This however could have been due to other factors like dependency of Boilers on other features in the dataset.
| Rating (A1-G) | True Count | Predicted Count |
|---|---|---|
| 2 | 1862 | 1863 |
| 5 | 1328 | 1407 |
| 6 | 1659 | 1706 |
| 7 | 1644 | 1696 |
| 9 | 1397 | 1553 |
| 10 | 1113 | 1163 |
Enabling Central space heating Boilers fueled by Oil with a room thermostat, saves energy consumption by regulating the heat based on the room temperature. This should improve the energy rating of the dwelling. However, the count of dwellings whose energy rating improved was just 2 as seen in Table 7. For other impacted dwellings, the rating either did not improve or it was degraded to a lower rating. This however could have been due to other factors like dependency of Oil fueled Boilers on other features in the dataset.
| Rating (A1-G) | True Count | Predicted Count |
|---|---|---|
| 2 | 1862 | 1864 |
| 5 | 1328 | 1361 |
| 6 | 1659 | 1712 |
| 9 | 1397 | 1594 |
| 10 | 1113 | 1131 |
| 12 | 418 | 454 |
| Model | Accuracy | Balanced Accuracy | ROC AUC | F1 Score | Time Taken |
|---|---|---|---|---|---|
| LGBMClassifier | 69.30391 | 65.35249 | 0.970416 | 0.692257 | 26.73003 |
| XGBClassifier | 69.33439 | 65.15978 | 0.971522 | 0.69228 | 36.40035 |
| RandomForestClassifier | 65.36023 | 60.56104 | 0.96446 | 0.651156 | 36.00189 |
| SVC | 65.62233 | 60.36718 | 0.955328 | 0.654104 | 457.4318 |
| BaggingClassifier | 62.9221 | 58.6617 | 0.930543 | 0.62794 | 29.62052 |
| ExtraTreesClassifier | 62.59905 | 57.69596 | 0.958162 | 0.623683 | 24.91773 |
| LogisticRegression | 63.00744 | 57.6725 | 0.961666 | 0.6284 | 4.493502 |
| DecisionTreeClassifier | 58.39937 | 54.18157 | 0.756123 | 0.584345 | 4.87028 |
| LinearDiscriminantAnalysis | 54.08997 | 50.59574 | 0.946072 | 0.542482 | 2.19966 |
| ExtraTreeClassifier | 50.48153 | 44.6584 | 0.705626 | 0.504578 | 0.698699 |
| KNeighborsClassifier | 50.17067 | 44.19705 | 0.84534 | 0.499022 | 5.897814 |
| LinearSVC | 48.31159 | 41.86486 | 0.915068 | 0.461619 | 458.6121 |
| CalibratedClassifierCV | 47.97635 | 40.67328 | 0.921641 | 0.467413 | 1670.794 |
| BernoulliNB | 40.54614 | 39.653 | 0.899813 | 0.401151 | 0.621117 |
| SGDClassifier | 43.17932 | 39.24871 | 0.865749 | 0.426669 | 16.9412 |
| NearestCentroid | 38.84554 | 38.47739 | NA | 0.387722 | 0.562689 |
| Perceptron | 39.37584 | 35.67045 | 0.820835 | 0.391434 | 3.949208 |
| PassiveAggressiveClassifier | 39.41851 | 31.87003 | 0.844482 | 0.380182 | 3.644474 |
| RidgeClassifierCV | 41.65549 | 28.86719 | 0.890969 | 0.376712 | 2.660572 |
| RidgeClassifier | 41.59454 | 28.82808 | 0.890879 | 0.376042 | 0.632503 |
| GaussianNB | 22.47349 | 24.44592 | 0.775536 | 0.23571 | 0.86986 |
| QuadraticDiscriminantAnalysis | 17.70084 | 22.10787 | 0.7524 | 0.183916 | 1.428048 |
| AdaBoostClassifier | 20.52298 | 12.29605 | 0.660264 | 0.13269 | 14.95013 |
| DummyClassifier | 16.78045 | 6.666667 | 0.5 | 0.048224 | 0.456144 |
The research was able to achieve both the research objectives. However, the point of discussion is made around what was done to achieve those objectives and at what was compromised in achieving them. Few arguments that include constructive criticism towards the research are discussed in this section.
Model Accuracy - Feature Selection balance: This research focused more on the retrofit analysis of the dwellings and its impact on energy efficiency. Because of this reason, the feature selection process was impacted. As shown in Table 2, a balance was struck between feature selection process and Accuracy of the model. Even though the accuracy of the final model was 69 percent which is lower than the first iteration that had almost all features, it was used for experimentation. These iterations also proved that the accuracy of the model largely depended on the feature selection process. It matters a lot which features are selected in the model and how important are they to predict the target variable.
Data Inconsistency: It was identified that almost half of the total columns were 99 percent empty. They had values for very few rows. To handle missing values, mean and mode for those features were used to fill the columns. This manipulated the data to a very large extent and affected the model accuracy.
Feature Correlation: This dataset had features that were highly correlated. A lot of features were derived from some other features in the dataset. Therefore modifying values for one feature corrupted the data and thus impacted the model accuracy and experiments. Values for features were modified during handling the missing values and while performing retrofit analysis.
The proposed Hypothesis in this research were evaluated by using Statistic inferences.
Null Hypothesis - individual experiments did not improve the existing energy rating of the dwelling
Alternative Hypothesis - individual experiments improved existing energy rating of the dwelling.
To get statistical insights One Way ANNOVA was performed which obtained a value of 0.19 for F-Statistics and a P value of 0.9. This was performed between the predicted energy ratings for all 4 experiments and the original energy rating for Test Data. The T tests performed for statistical inferences are discussed below:
T-test between original and experiment 1: statistic=0.29, pvalue=0.76
T-test between original and experiment 2: statistic=0.25, pvalue=0.80
T-test between original and experiment 3: statistic=0.81, pvalue=0.41
T-test between original and experiment 4: statistic=0.81, pvalue=0.41
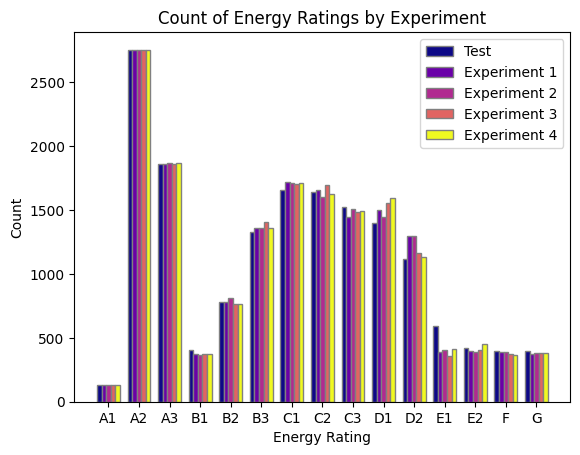
The T Tests and ANNOVA, conclude that there is no significant difference between the mean of all 4 experiments and the Predicted test value. It means that the research failed to reject the Null Hypothesis and that the Retrofit solutions did not significantly impact the energy rating of the dwellings. It can be confirmed through data by observing the count of dwellings with improved energy ratings as shown in Figure 7.
It would have been an ideal case if the suggested retrofit solutions significantly improved the energy ratings of dwellings, however, the research answered the extent to which Machine learning data driven approach can help in predicting the energy efficiency of domestic buildings.
Restating the Research Question: To what extent Machine learning algorithms can be applied to analyse energy utilization for domestic buildings in Ireland based on their BER (Building Energy Rating) and the impacts of Retrofit Interventions proposed?This section discusses if the project was able to answer the research question and objectives. This research was able to:
Objective 1: Achieve a data driven Machine Learning approach to predict Energy Rating(BER) of domestic buildings in Ireland.
Objective 2: Study the impact of retrofit solutions on energy consumption of domestic buildings.
On evaluating the results of the research, it can be concluded that both the objectives of the research were achieved. Using just 101 features, the machine learning model LGBM Classifier was able to predict the BER for around 16 thousand buildings with an accuracy of 69 percent. Several insights were drawn from this result including the role of feature selection played in model accuracy with a dataset that has features with high correlation. Even though researchers were able to formulate a better model like [20], they had to used a synthetic dataset in order to achieve high accuracies. Also, the impact of retrofit solutions was not substantial in their research. Renewable energy sources like solar as secondary source of energy for heating purposes in homes could also help in reducing the load for a good six months in colder countries. The data however was not substantial to understand the impact of solar installation on calculating energy rating. The research does not entail any ethical concerns as the data set is published by a government of Ireland authority. The data is compliant with (General Data Protection Regulations (GDPR)66 guidelines and can not be used to identify any dwelling since the owner name and address are not included in the dataset. This field of research could be further explored by understanding the dependencies of features on one another. This research performed a few experiments to understand the impact of retrofit solutions, however complete understanding of this correlation could also benefit the results. The limitation of this research was the lack of real information about renewable resources in the dataset. This information would have helped in performing better retrofit analysis. The process of finding the best retrofit solution for improving the energy rating to B2 can be automated by using Optimization techniques. It would help in faster convergence of the best feature variables to upgrade the existing energy rating. Vice-a-versa, a model could be built upon this research which would help building planners achieve the right values for each feature in order to construct a dwelling with minimum B2 rating at minimum cost. Further research within the sector can promise to enhance the understanding of the current energy consumption of Ireland's building stock and the potential for its improvement to reduce energy demand and CO2 emissions while increasing the use of renewable sources of energy.
IECE Transactions on Social Statistics and Computing
ISSN: 2996-8488 (Online)
Email: [email protected]

Portico
All published articles are preserved here permanently:
https://www.portico.org/publishers/iece/