IECE Transactions on Emerging Topics in Artificial Intelligence
ISSN: 3066-1676 (Online) | ISSN: 3066-1668 (Print)
Email: [email protected]

The abnormal volatility in financial markets can have a profound impact on the global economy and financial systems, such as market crashes, irregular trading, and financial fraud [28]. These unexpected events are often accompanied by drastic price fluctuations and changes in trading volume, which pose significant risks to investors, regulatory bodies, and financial institutions [13, 27]. Therefore, accurately identifying abnormal behaviors in financial time series is of paramount importance for risk management and market stability. However, financial market data exhibit high non-linearity, non-stationarity, and multi-scale characteristics, and abnormal events are often hidden within complex time series patterns, making traditional anomaly detection methods insufficient for practical needs [21]. The construction of efficient anomaly detection systems that can identify abnormalities in real time within the dynamic environment of financial markets remains a critical issue in the field of financial technology [2].
In recent years, deep learning has made significant advancements in time series analysis, offering new approaches for financial anomaly detection [6, 14, 20]. Long Short-Term Memory (LSTM) networks have been widely adopted for financial market trend modeling due to their superior performance in handling temporal dependencies [24]. However, LSTM models still face limitations in capturing long-term dependencies and detecting sudden anomalies. In contrast, the self-attention mechanism in Transformer models enables the modeling of global information, making them particularly effective in capturing short-term fluctuations and local anomaly patterns [11]. Therefore, combining LSTM and Transformer models can create a complementary framework for modeling both long- and short-term dependencies [19]. Additionally, wavelet transform (WT), as an effective signal processing tool, enables multi-scale decomposition of time series, facilitating the extraction of features across different frequencies and enhancing the model's capability in identifying both long-term market trends and short-term anomalies [33].
Despite significant progress in financial anomaly detection, several challenges remain [34]. Many traditional statistical models, such as ARIMA and GARCH, struggle to capture the nonlinear and multi-scale characteristics of financial markets, limiting their effectiveness in anomaly detection [3]. Single deep learning models often fail to simultaneously account for both long-term dependencies and short-term fluctuations in time series, making it difficult to accurately characterize the dynamic nature of financial markets [4]. Moreover, financial anomalies are often abrupt and transient, posing challenges in effectively extracting key anomaly features from time series while minimizing false positives and false negatives. To address these issues, this study introduces a model that integrates wavelet transform, LSTM, and Transformer, aiming to enhance the comprehensiveness and accuracy of financial time series anomaly detection.The main contributions of this paper are as follows:
Proposing the WaveLST-Trans model, which integrates Wavelet Transform, LSTM, and Transformer to capture multi-scale features, enabling the separate processing of long-term trends and short-term fluctuations, thereby improving anomaly detection accuracy.
Designing a feature fusion strategy, where Wavelet Transform decomposes the time series, feeding low-frequency components into LSTM to extract long-term dependencies, and high-frequency components into Transformer to identify localized anomalies, achieving efficient multi-scale feature integration.
Conducting experiments on multiple financial market datasets to validate the superiority of WaveLST-Trans over traditional statistical, machine learning, and deep learning models, and performing ablation studies to analyze module contributions, ensuring model effectiveness and stability.
The structure of this paper is organized as follows: Section 2 reviews related research on financial time series anomaly detection, covering traditional statistical methods, the application of deep learning in finance, and the development of hybrid models. Section 3 provides a detailed description of the WaveLST-Trans model, including data preprocessing, wavelet transform, and the LSTM-Transformer module. Section 4 presents the experimental design, covering datasets, experimental setup, and validating the model's performance through comparative and ablation experiments. Section 5 concludes the study and discusses future research directions.
In the field of financial time series anomaly detection, traditional methods mainly rely on statistical models and machine learning algorithms. These approaches have achieved certain success in early research, but often exhibit limitations when faced with the complex dynamics of financial markets [25]. Among them, the Autoregressive Integrated Moving Average (ARIMA) model is a widely used statistical method for time series forecasting. It detects anomalies by modeling the linear dependencies of data, but its adaptability to nonlinear and abrupt changes is relatively poor [31]. The Generalized Autoregressive Conditional Heteroskedasticity (GARCH) model and its variants (such as EGARCH and TGARCH) focus on volatility modeling in financial markets. These models effectively describe the heteroscedasticity of financial time series, but still suffer from a delay in identifying sudden anomalies [31].In addition to statistical models, Isolation Forest, an unsupervised anomaly detection method, identifies outliers by random partitioning of data points. It is suitable for high-dimensional data but does not account for temporal dependencies [29]. The Local Outlier Factor (LOF) calculates local abnormality based on data density distributions. While it is effective for detecting certain patterns of anomalies, it is highly sensitive to noisy data [22]. Support Vector Machines (SVM) and its extended versions, such as One-Class SVM, distinguish between normal and anomalous data by constructing hyperplanes in high-dimensional space. While these methods are suitable for static data, they perform poorly when handling dynamic time series anomalies [18].
In comparison to the aforementioned methods, the WaveLST-Trans model proposed in this paper not only captures the long-term dependencies of time series but also models short-term abrupt anomalies. Furthermore, by using wavelet transform to extract multi-scale features, it improves the accuracy and stability of anomaly detection. By combining the strengths of LSTM and Transformer, WaveLST-Trans complements each other in modeling temporal dependencies and extracting local features, while leveraging wavelet transform to enhance the model's adaptability to different time scales, thus enabling a more comprehensive identification of abnormal events in financial markets.
In recent years, deep learning has been widely applied in financial time series anomaly detection and risk management, demonstrating superior performance compared to traditional methods. Long Short-Term Memory (LSTM) networks, which can model long-term dependencies, have shown excellent results in financial market trend prediction and anomaly detection [23]. However, LSTM is susceptible to the vanishing gradient problem when processing long time series and has limited ability to capture short-term abrupt anomalies. Gated Recurrent Units (GRU), as a simplified version of LSTM, reduce computational complexity and provide comparable performance in some financial applications, but they still struggle to effectively model local mutations in time series [23]. Convolutional Neural Networks (CNNs), typically used for computer vision tasks, have also been applied to financial time series feature extraction in recent years, such as learning market patterns through one-dimensional convolutional layers [35]. However, CNNs rely on fixed-size receptive fields, making it difficult to capture long-range dependencies, and they perform poorly with non-stationary time series data. Recently, Transformer models have gained attention due to their self-attention mechanism, which excels at globally modeling the relationships between data points and is particularly adept at capturing local anomaly patterns. However, due to the lack of implicit modeling of temporal information, Transformer models may have limitations in modeling long-term trends [30]. Moreover, some hybrid models have emerged, such as combining LSTM with CNN to use CNN for local feature extraction, followed by LSTM to model temporal dependencies [10], or employing variant Transformers (such as Informer and Time Transformer) to optimize time series modeling efficiency. Nonetheless, these models still face issues such as high computational complexity and limited generalization capabilities. In comparison to the aforementioned deep learning methods, the WaveLST-Trans model proposed in this paper utilizes LSTM to model the long-term dependencies in financial time series, while employing Transformer to enhance the model's ability to capture short-term anomalous fluctuations, overcoming the limitations of a single deep learning method. Additionally, the introduction of wavelet transform allows the model to learn time series features at different scales, thereby improving the model's adaptability to market trends and local mutations, resulting in more accurate and robust anomaly detection.
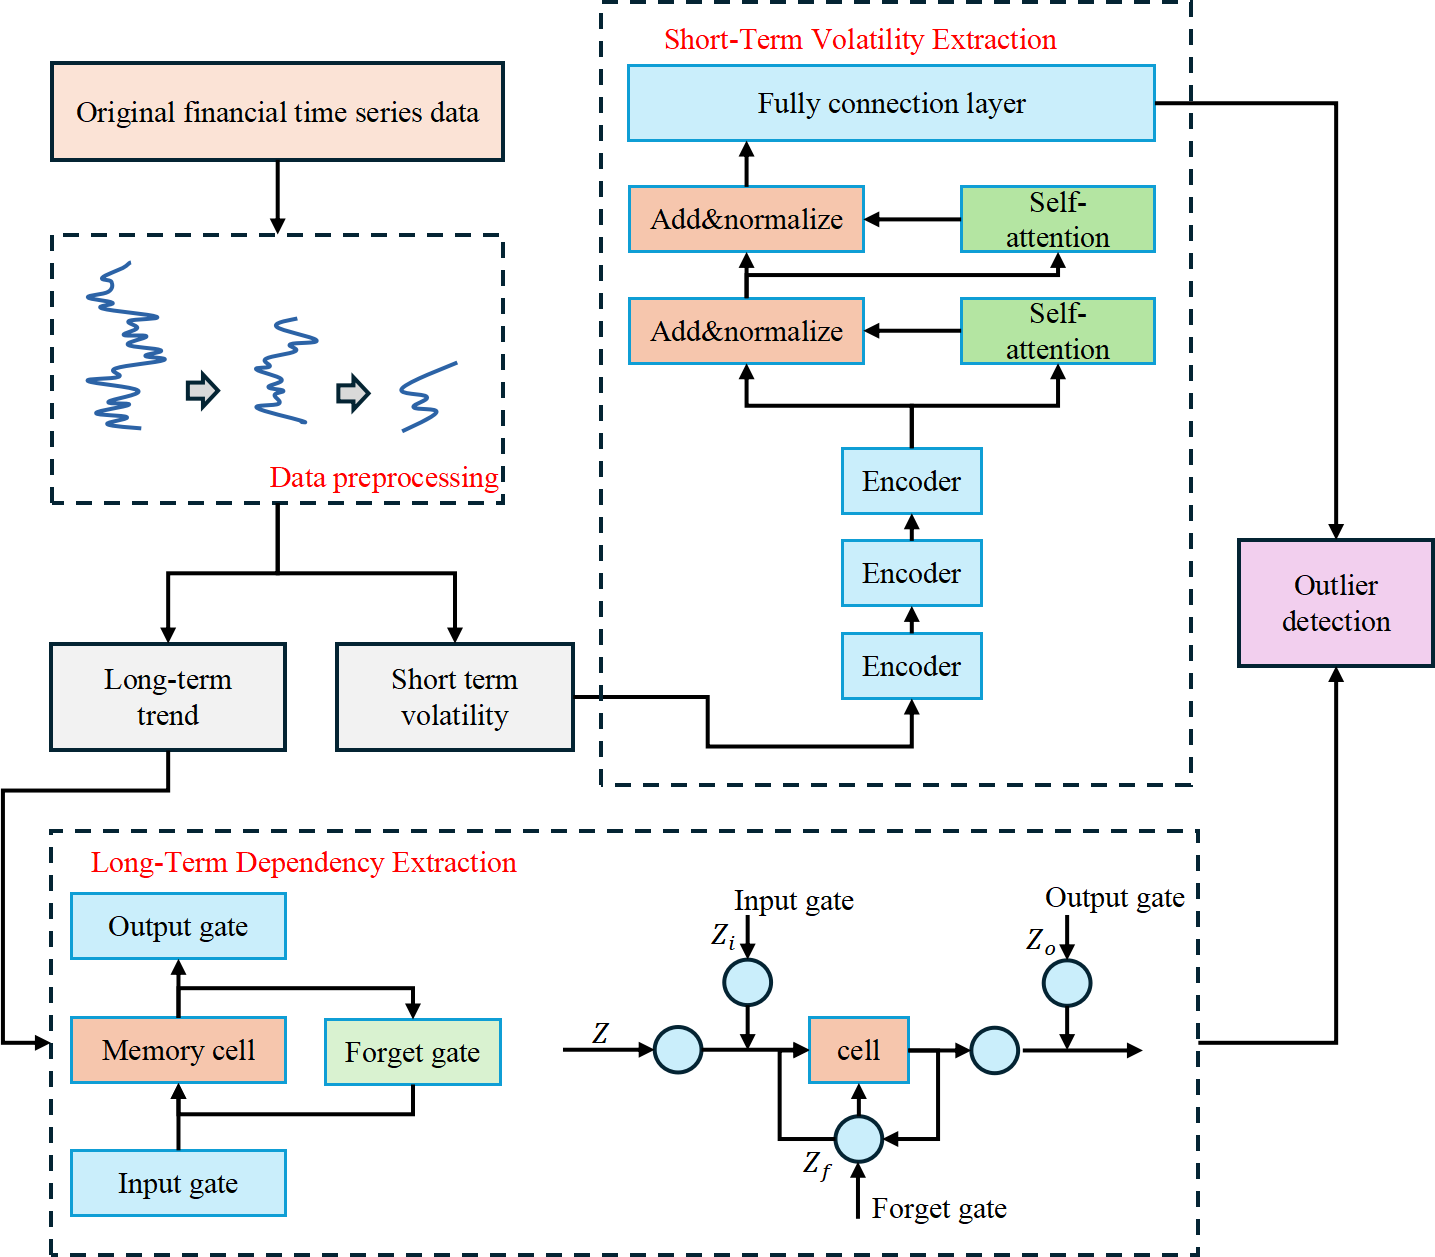
The WaveLST-Trans model consists of a wavelet transform preprocessing module, an LSTM long-term dependency modeling module, a Transformer short-term fluctuation capturing module, and a feature fusion layer. Financial time series typically exhibit both long-term trends and short-term fluctuations, making it challenging for a single model to capture these features simultaneously. This limitation affects the accuracy of anomaly detection. To address this issue, WaveLST-Trans first applies wavelet transform for multi-scale decomposition of time series data, breaking down the raw data into low-frequency components (long-term trends) and high-frequency components (short-term fluctuations). The low-frequency components are fed into the LSTM network to capture long-term dependencies, while the high-frequency components are input into the Transformer module, where the self-attention mechanism extracts short-term fluctuation features. The outputs of LSTM and Transformer are integrated in the feature fusion layer, ensuring that the model effectively learns anomaly patterns across different time scales. After passing through a fully connected layer, the anomaly detection module computes anomaly scores, ultimately identifying anomalous time steps. The overall architecture of the model is illustrated in Figure 1.
WaveLST-Trans integrates LSTM and Transformer to achieve precise multi-scale modeling, enhancing the accuracy and robustness of financial time series anomaly detection. LSTM is responsible for capturing long-term trends, leveraging its gating mechanism to model temporal dependencies, making it suitable for detecting structural market changes such as sustained price increases or declines. In contrast, Transformer utilizes self-attention to efficiently extract short-term fluctuations, identifying localized sudden anomalies such as market shocks or short-term trading irregularities. The feature fusion layer combines the outputs of LSTM and Transformer, enabling the model to learn both long-term dependency patterns and short-term mutation features, effectively covering anomalies across different time scales [16]. Compared to traditional methods, WaveLST-Trans offers stronger multi-scale feature representation, overcoming the limitations of ARIMA and GARCH on non-stationary data and surpassing Isolation Forest and Local Outlier Factor (LOF) in modeling time dependencies. Additionally, compared to standalone LSTM or Transformer models, WaveLST-Trans combines long-term memory capabilities with short-term anomaly detection, making it suitable for various market environments.
In the computational process, the wavelet transform module first decomposes the raw time series into different frequency components, where low-frequency signals capture long-term market trends, and high-frequency signals reflect short-term fluctuations and local anomalies [26]. The low-frequency signals are fed into LSTM to learn long-term dependencies, while the high-frequency signals are input into Transformer to extract short-term fluctuation features. In the feature fusion layer, the feature vectors from LSTM and Transformer are either concatenated or adaptively weighted, ensuring the model effectively leverages multi-scale information to enhance anomaly detection accuracy. Finally, the fused features are passed through a fully connected layer, and a predefined threshold is applied to determine anomalies at each time step, enabling precise financial market anomaly detection.
The design of WaveLST-Trans not only enhances financial time series anomaly detection but also strengthens its applicability in risk warning systems. In market regulation, quantitative trading, and credit evaluation, this model can promptly identify potential market risks, providing more precise decision support for financial institutions [1]. Compared with traditional methods, WaveLST-Trans offers greater adaptability to the complexities of financial markets, serving as both a theoretical foundation and practical reference for future advancements in financial risk management tools.
WaveLST-Trans employs Wavelet Transform for data preprocessing to enhance the multi-scale feature representation of time series data [5]. Financial time series typically exhibit both long-term trends and short-term fluctuations, and directly modeling the raw data may make it difficult for the model to distinguish between these components, thereby affecting the accuracy of anomaly detection. The Wavelet Transform is particularly suitable for this task due to its ability to decompose a time series into multiple frequency bands, allowing for the extraction of both low-frequency components (representing long-term trends) and high-frequency components (representing short-term fluctuations).However, there are some trade-offs associated with this approach. While the Wavelet Transform effectively decomposes the time series into meaningful components, there is a computational cost involved in performing the transform and the subsequent model training. Additionally, the choice of wavelet function and decomposition level can impact the model's performance, and selecting inappropriate parameters may lead to overfitting or underfitting. Despite these challenges, this preprocessing approach ensures that the model effectively learns abnormal patterns across different time scales, while simultaneously reducing noise interference and improving the stability and accuracy of anomaly detection. Figure 2 illustrates the process of the data preprocessing module.
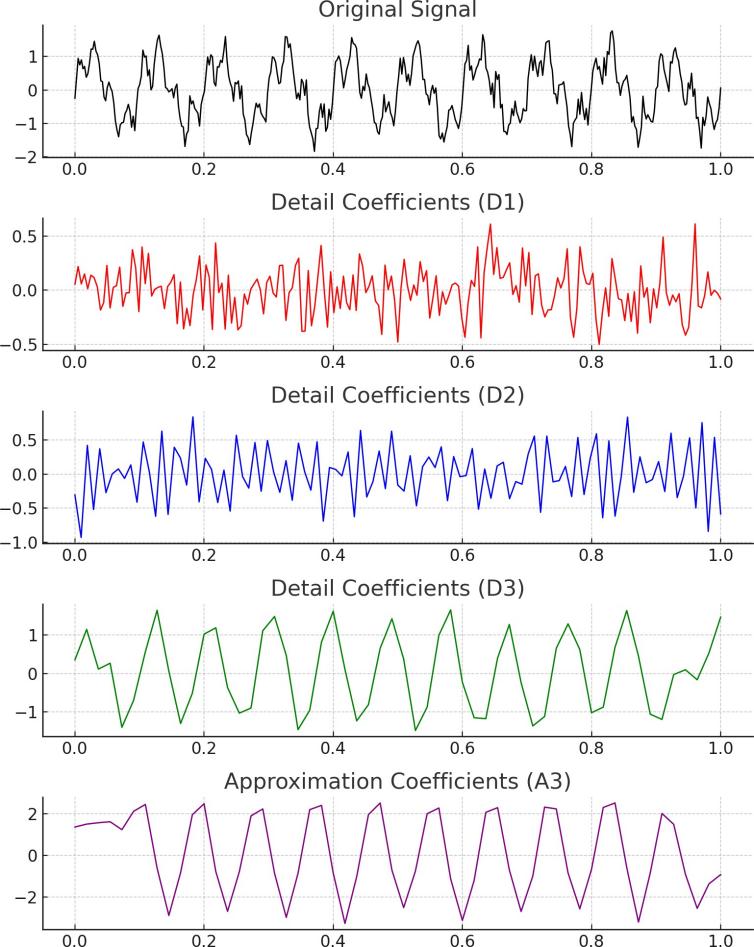
In data preprocessing, the core idea of wavelet transform is to perform time-frequency decomposition on the time series, transforming it into multi-scale feature representations. Given a discrete time series wavelet transform applies a scaling factor and a time translation factor to the signal. Using a mother wavelet function , the Continuous Wavelet Transform (CWT) representation is obtained as follows:
Due to the high dimensionality and non-stationarity of financial time series, Discrete Wavelet Transform (DWT) is adopted in this paper to improve computational efficiency. The time series is decomposed into low-frequency components and high-frequency components as follows:
In this process, represent the low-pass and high-pass filters, respectively, which are used to decompose the time series into different scale-dependent features. The low-frequency component primarily captures long-term trend information, whereas the high-frequency component reflects short-term fluctuations and local anomalies. After the initial decomposition, the low-frequency component can undergo recursive decomposition to extract smoother long-term trends, where represents the number of decomposition levels. In this paper, we select Daubechies (db4) wavelet as the mother wavelet, as experimental results demonstrate its ability to effectively adapt to both the smoothness and fluctuation characteristics of financial time series data. Finally, after wavelet transform processing, the low-frequency component is fed into the LSTM module to model long-term dependencies, while the high-frequency component is input into the Transformer module to learn short-term fluctuation features:
In addition to multi-scale feature extraction via wavelet transform, this study applies data normalization to ensure that data across different time steps are processed on a consistent scale, thereby improving model convergence speed and stability. The mean and standard deviation represent the statistical characteristics of the data. The normalization is performed as follows:
Considering the non-stationarity of financial market data, this study further employs a Sliding Window mechanism to segment the time series into fixed-size windows. Given a window size , the model input at time step is defined as: This approach ensures that the model effectively utilizes historical information, while preventing excessively long time series inputs that may lead to high computational complexity. After sliding window processing, the low-frequency and high-frequency components are separately fed into the LSTM and Transformer modules, where they undergo feature extraction and anomaly detection.
Mathematically, the Wavelet Transform provides a multi-resolution analysis of the data, where each resolution corresponds to a different scale of the time series. This is achieved by convolving the signal with a wavelet function, which is localized in both time and frequency, making it well-suited for capturing time-varying behaviors in financial data. By decomposing the time series into these components, we are able to isolate the long-term trends and short-term anomalies, which enhances the model's ability to detect abnormal patterns at different time scales. The low-frequency components are fed into the LSTM network, which learns the long-term dependencies of the time series, while the high-frequency components are input into the Transformer module, where the self-attention mechanism extracts short-term fluctuation features.
Financial market time series data often exhibit both long-term trend variations and short-term extreme fluctuations, making it challenging for a single model to effectively capture both characteristics. Traditional LSTM, leveraging its gating mechanism, excels at learning long-term dependencies in time series but is limited in detecting short-term market fluctuations and local anomalies. On the other hand, Transformer, with its self-attention mechanism, can effectively model global information, making it well-suited for short-term anomaly detection. However, using Transformer alone may lead to the neglect of long-term dependencies. This module integrates both LSTM and Transformer, combining their strengths to enhance multi-scale time series modeling. The architecture of this module is illustrated in Figure 3.
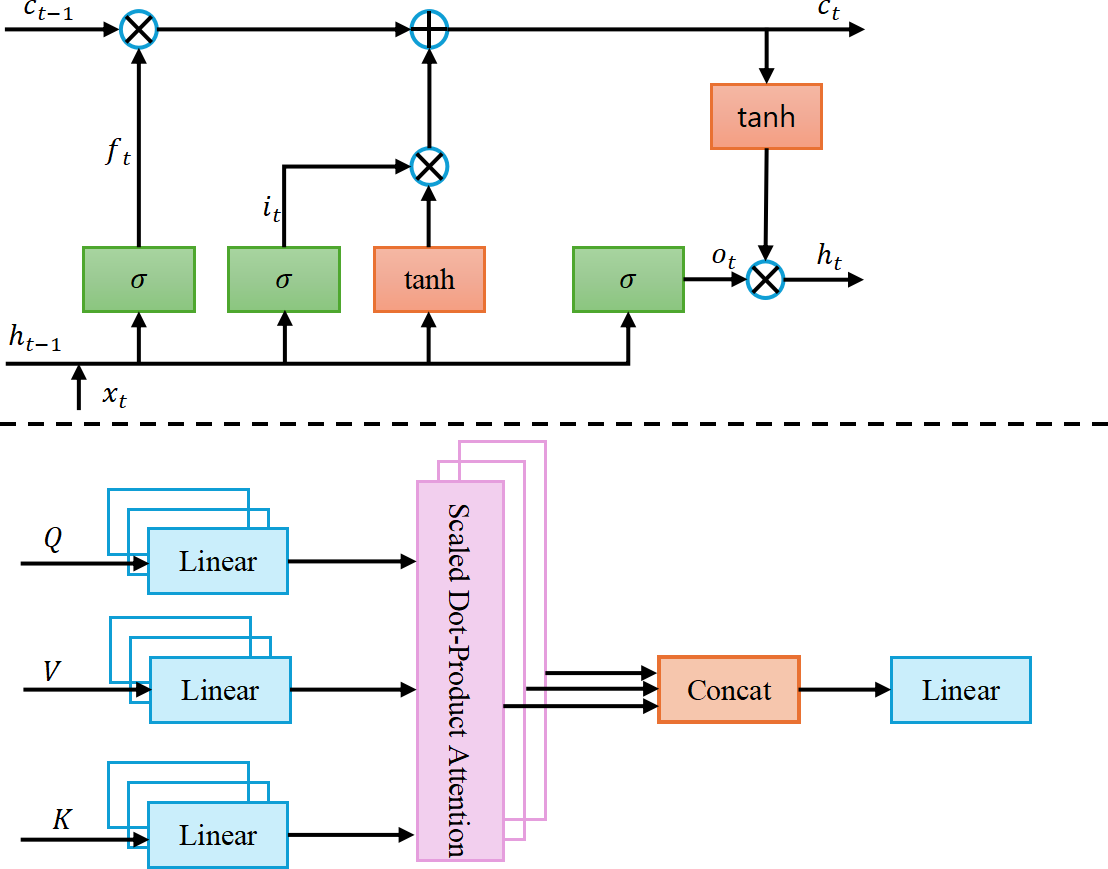
LSTM is primarily used to capture long-term dependency patterns in financial markets, making it suitable for detecting price trends, market cyclicality, and other structural features. Traditional statistical methods, such as ARIMA and GARCH, struggle to effectively model the nonlinear dynamics of long-term time series, whereas LSTM, through its gating mechanism, controls information storage and forgetting, enabling the learning of long-term temporal features. In this study, Wavelet Transform (WT) is applied to decompose financial time series into low-frequency and high-frequency components. The low-frequency component is fed into the LSTM layer to extract long-term dependency features, which are then passed to the feature fusion layer, where they are integrated with the short-term features extracted by Transformer. LSTM consists of three gates: Forget Gate, Input Gate, and Output Gate, with their computations as follows:
The hidden state serves as the output feature of the LSTM module, which is then passed to the feature fusion layer to be combined with short-term features extracted by Transformer, forming the final time series representation. By leveraging its gating mechanism, LSTM mitigates the vanishing gradient problem, enabling the model to capture long-term trends and enhancing the stability of anomaly detection.
The Transformer module is primarily used for modeling short-term market fluctuations, making it suitable for detecting sudden market changes caused by policy adjustments, market manipulations, or breaking news. Unlike LSTM, which relies on recursive computations to handle temporal dependencies, Trans former utilizes the self-attention mechanism to model global time dependencies and precisely capture short-term fluctuation features. The input to Transformer is the high-frequency component extracted by Wavelet Transform, which is processed through a multi-head self-attention mechanism to compute the weighted relationships between time steps, effectively focusing on short-term anomaly patterns.
The Transformer module first computes Query (Q), Key (K), and Value (V), where , , are learnable parameter matrices. It then calculates the Scaled Dot-Product Attention, where acts as a scaling factor to keep attention scores within an appropriate range, preventing vanishing or exploding gradients:
To enhance modeling capability, the Multi-Head Attention mechanism is employed to compute multiple independent attention mappings, allowing the model to capture diverse short-term anomaly patterns more effectively. Finally, the output is passed through a Feed-Forward Network (FFN) for feature transformation, further refining the learned representations
| Dataset | Market Type | Time Granularity | Features | Application |
|---|---|---|---|---|
| Binance | Cryptocurrency | Minute-level | Price, Volume, Order book | High-frequency anomalies, Market manipulation |
| SP 500 | Stock Market | Daily-level | Price, Volume, Adjusted Close | Long-term trend anomalies, Market crashes |
Since Transformer lacks inherent sequential modeling capability, this study employs Positional Encoding to explicitly introduce temporal position information. This allows Transformer to not only focus on short-term market fluctuations but also retain the sequential characteristics of time series, thereby enhancing its anomaly detection performance.
The hybrid architecture of WaveLST-Trans integrates LSTM's capability in long-term trend modeling with Transformer's ability to capture short-term fluctuations, while leveraging Wavelet Transform's multi-scale signal decomposition for feature extraction. This design enables the model to efficiently identify complex anomaly patterns in financial time series.
This study selects two publicly available datasets, Binance cryptocurrency market data [7] and S&P 500 index constituent stock data [15], to comprehensively evaluate the performance of WaveLST-Trans in financial time series anomaly detection. These datasets represent high-frequency trading markets and traditional stock markets, covering financial anomalies across different time scales, allowing the model's applicability to be validated in various market environments. The Binance dataset is sourced from Binance, one of the world's largest cryptocurrency exchanges, and includes minute-level trading data for major cryptocurrencies such as Bitcoin (BTC) and Ethereum (ETH), with features including open price, close price, highest price, lowest price, trading volume, and taker buy volume. The cryptocurrency market is highly volatile, with frequent anomalous trades, making it well-suited for studying short-term extreme fluctuations. This dataset provides the Transformer module with rich short-sequence information, enabling a thorough evaluation of the model's short-term anomaly detection capabilities.
| Model | Dataset | Accuracy | Recall | Precision | F1-score | MAE |
|---|---|---|---|---|---|---|
| WaveLST-Trans | Binance | 0.92 | 0.90 | 0.87 | 0.88 | 0.15 |
| S&P 500 | 0.91 | 0.89 | 0.85 | 0.87 | 0.18 | |
| TFT[9] | Binance | 0.90 | 0.88 | 0.88 | 0.87 | 0.14 |
| S&P 500 | 0.89 | 0.85 | 0.84 | 0.84 | 0.19 | |
| TimeDiff[17] | Binance | 0.89 | 0.86 | 0.85 | 0.85 | 0.13 |
| S&P 500 | 0.88 | 0.84 | 0.82 | 0.83 | 0.17 | |
| STGNN[8] | Binance | 0.88 | 0.85 | 0.86 | 0.85 | 0.16 |
| S&P 500 | 0.87 | 0.83 | 0.81 | 0.82 | 0.20 | |
| TS2Vec[32] | Binance | 0.86 | 0.84 | 0.82 | 0.83 | 0.18 |
| S&P 500 | 0.85 | 0.80 | 0.79 | 0.79 | 0.21 | |
| CNN-LSTM-IF[12] | Binance | 0.85 | 0.82 | 0.80 | 0.81 | 0.19 |
| S&P 500 | 0.84 | 0.79 | 0.78 | 0.78 | 0.23 |
In contrast, the S&P 500 dataset reflects long-term trends in traditional stock markets. This study selects daily-level data for the S&P 500 index and its constituent stocks, including open price, close price, highest price, lowest price, trading volume, and adjusted close price, which collectively represent the overall performance of the U.S. stock market. Unlike cryptocurrency markets, where anomalies manifest as short-term extreme fluctuations, stock market anomalies typically occur over longer time horizons, influenced by financial crises, policy changes, or industry shifts. Additionally, historical stock market data is more comprehensive, covering multiple economic cycles, allowing the experiment to assess the model's robustness and generalization across different market conditions. Table 1 summarizes their key characteristics, including data sources, time granularity, feature dimensions, and applicable scenarios.
For the WaveLST-Trans model, we selected a learning rate of 0.001, a batch size of 64, and the Adam optimizer based on extensive preliminary testing, achieving a balance between model complexity and performance for both Binance and S&P 500 datasets. The Binance dataset was chosen for its high-frequency, volatile nature, ideal for testing the model's ability to detect For the WaveLST-Trans model, we selected a learning rate of 0.001, a batch size of 64, and the Adam optimizer based on extensive preliminary testing, achieving a balance between model complexity and performance for both Binance and S&P 500 datasets. The Binance dataset was chosen for its high-frequency, volatile nature, ideal for testing the model's ability to detect
In this experiment, to comprehensively evaluate the performance of WaveLST-Trans in financial time series anomaly detection, we selected TFT (Temporal Fusion Transformer), TimeDiff (Diffusion Models for Time Series), STGNN (Spatio-Temporal Graph Neural Networks), TS2Vec (Self-Supervised Learning for Time Series), and CNN-LSTM-IF (Hybrid Deep Learning Models) as benchmark models. Experiments were conducted on both the Binance cryptocurrency market dataset and the S&P 500 stock market dataset.These benchmark models represent mainstream approaches in recent years for time series modeling, anomaly detection, and forecasting, offering strong capabilities in capturing long-and-short-term dependencies. The evaluation was based on five key metrics: Accuracy, Recall, Precision, F1-score, and Mean Absolute Error (MAE). The experimental results are summarized in Table 2. From the experimental results, it is evident that WaveLST-Trans demonstrates strong stability and superiority across all evaluation metrics. Particularly in terms of accuracy, recall, and F1-score, the model outperforms the benchmark models, indicating its strong generalization capability in financial time series anomaly detection.On the Binance dataset (cryptocurrency market), WaveLST-Trans achieves a 6% improvement in recall compared to TS2Vec and a 8% increase compared to CNN-LSTM-IF, proving its effectiveness in capturing short-term extreme fluctuations. In contrast, TS2Vec, based on self-supervised learning, and CNN-LSTM-IF, a hybrid deep learning model, exhibit weaker performance in detecting short-period anomalies. Additionally, in F1-score, WaveLST-Trans surpasses STGNN by 3%, demonstrating its ability to balance precision and recall effectively in anomaly detection tasks.
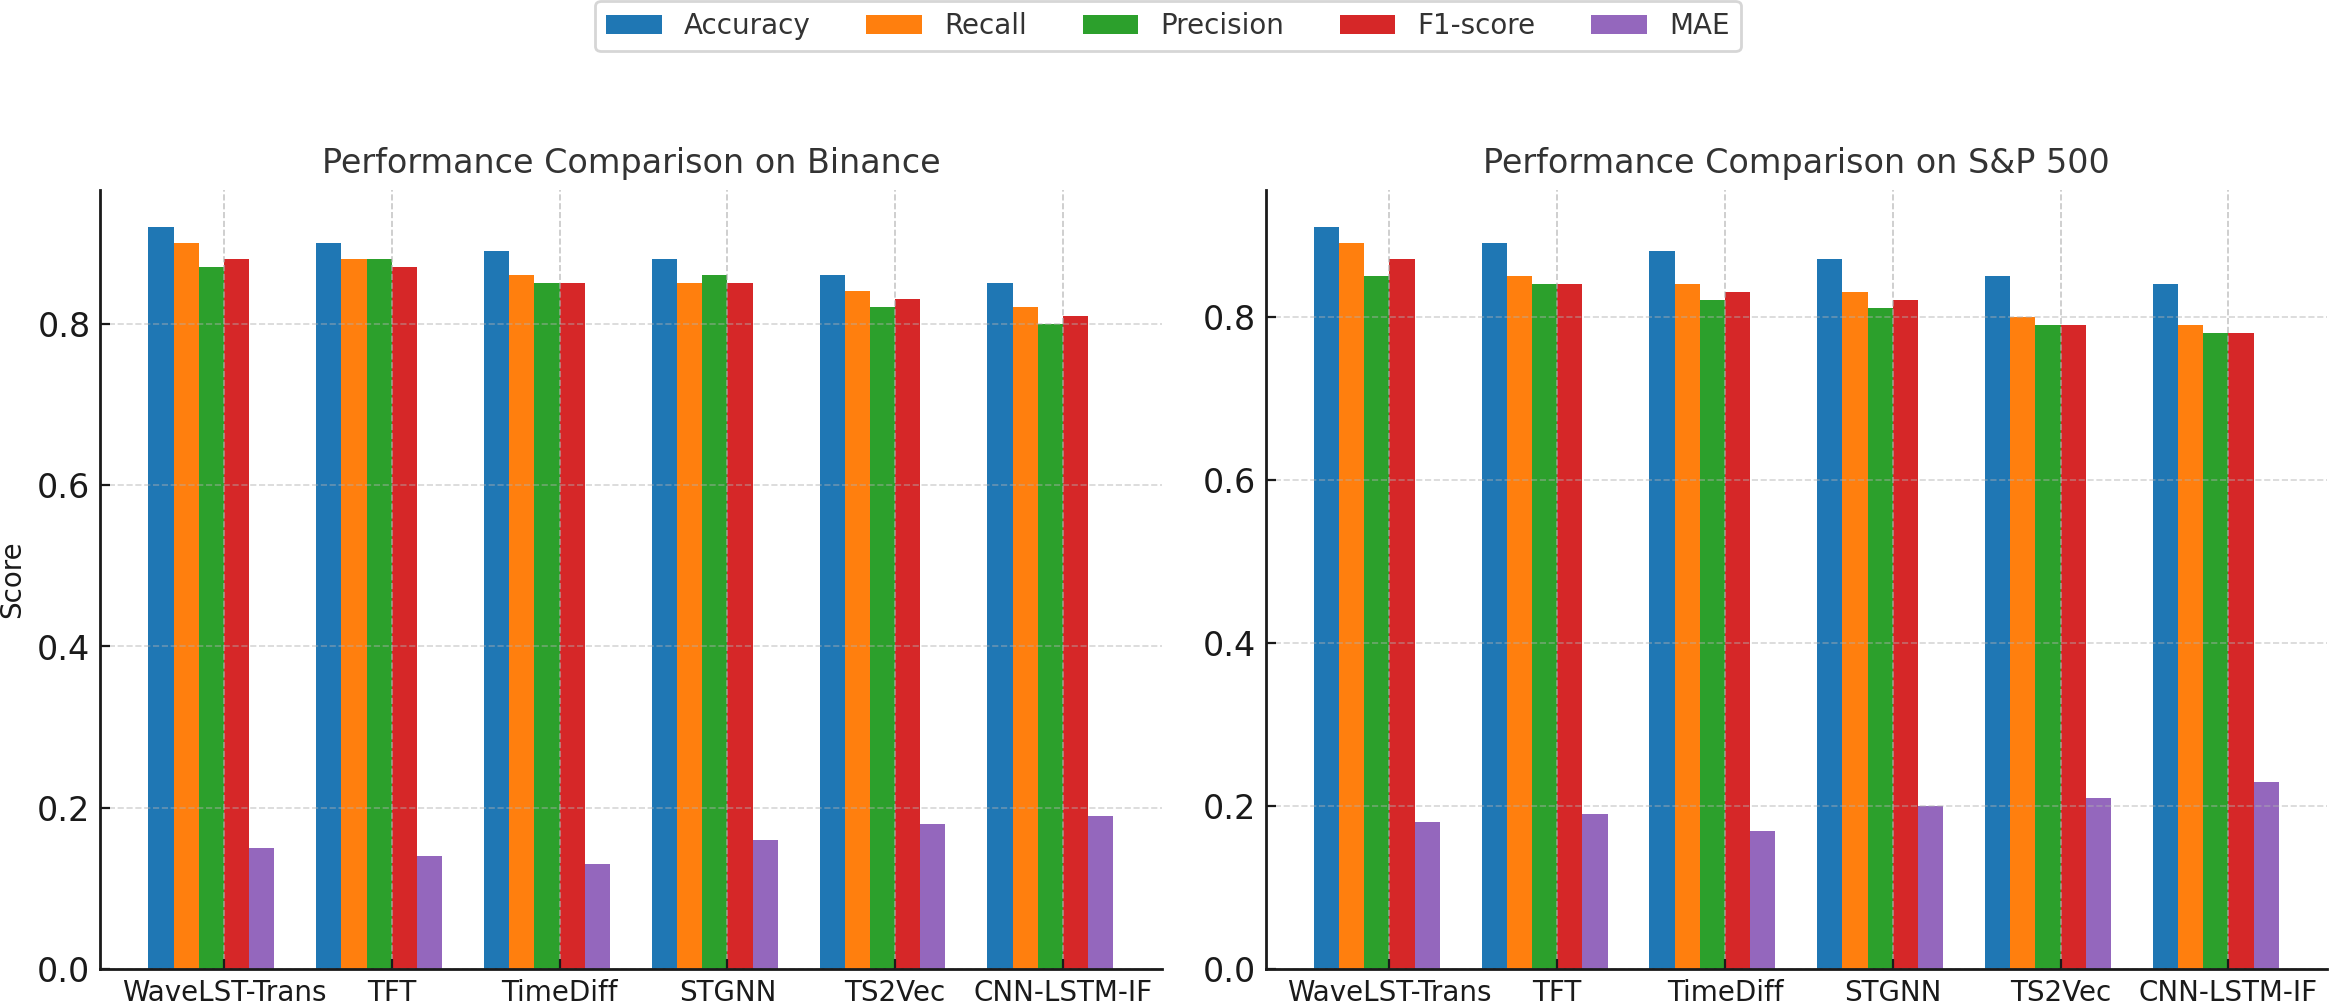
On the S&P 500 dataset (traditional stock market), WaveLST-Trans also outperforms other models in precision and F1-score, achieving 3% and 5% higher F1-score than TFT and TimeDiff, respectively. This suggests that the model can effectively reduce false positive rates when detecting long-term trend deviations. Although TFT performs slightly better in some metrics (e.g., precision), its lower recall indicates that while it models long-term trends effectively, it struggles to identify abnormal transactions or market anomalies. Additionally, TimeDiff achieves the best MAE scores (0.13 on the Binance dataset and 0.17 on the S&P 500 dataset), highlighting the advantage of diffusion models in continuous time series forecasting but showing no significant advantage in discrete anomaly detection tasks.
| Model Variant | Dataset | Accuracy | Recall | Precision | F1-score | MAE |
|---|---|---|---|---|---|---|
| WaveLST-Trans (Full Model) | Binance | 0.92 | 0.90 | 0.87 | 0.88 | 0.15 |
| S&P 500 | 0.91 | 0.89 | 0.85 | 0.87 | 0.18 | |
| w/o without Wavelet Transform (WT) | Binance | 0.89 | 0.86 | 0.85 | 0.85 | 0.17 |
| S&P 500 | 0.88 | 0.85 | 0.83 | 0.84 | 0.20 | |
| w/o without LSTM | Binance | 0.87 | 0.84 | 0.83 | 0.83 | 0.18 |
| S&P 500 | 0.86 | 0.82 | 0.81 | 0.82 | 0.21 | |
| w/o without Transformer | Binance | 0.86 | 0.82 | 0.84 | 0.83 | 0.19 |
| S&P 500 | 0.85 | 0.81 | 0.80 | 0.80 | 0.22 | |
| w/o without WT + LSTM | Binance | 0.84 | 0.80 | 0.78 | 0.79 | 0.22 |
| S&P 500 | 0.82 | 0.78 | 0.76 | 0.77 | 0.24 | |
| w/o without WT + Transformer | Binance | 0.83 | 0.78 | 0.77 | 0.78 | 0.24 |
| S&P 500 | 0.83 | 0.76 | 0.74 | 0.75 | 0.26 | |
| w/o without LSTM + Transformer | Binance | 0.82 | 0.77 | 0.75 | 0.76 | 0.25 |
| S&P 500 | 0.80 | 0.75 | 0.72 | 0.74 | 0.27 |
As illustrated in Figure 4, WaveLST-Trans combines the long-term dependency modeling capability of LSTM with the short-term fluctuation capturing ability of Transformer, allowing it to perform well across different market environments. Compared to traditional deep learning models (e.g., CNN-LSTM-IF), it provides more stable detection results; compared to self-supervised learning methods (e.g., TS2Vec), it offers better adaptability to both short-term and long-term patterns; and compared to time series diffusion models (e.g., TimeDiff), it outperforms in anomaly classification tasks. Overall, WaveLST-Trans consistently delivers superior performance in financial anomaly detection across various market conditions, demonstrating strong applicability and robustness.
In this experiment, to verify the effectiveness of each module in WaveLST-Trans, we designed a series of ablation experiments by removing different key components of the model and evaluating their impact on performance. The experiments were conducted on the datasets to assess how each module contributes to the overall model performance. The primary objective of the ablation study is to analyze the individual contributions of each component to the model's effectiveness. The experimental results are summarized in Table 3.
The ablation study results presented in Table 3 confirm the effectiveness of each component within the WaveLST-Trans model. On the Binance dataset, removing the Wavelet Transform (WT) led to a drop in accuracy from 0.92 to 0.89 and in F1-score from 0.88 to 0.85, underscoring its role in capturing multi-scale features. Excluding either the LSTM or Transformer module resulted in an F1-score of 0.83 in both cases, which highlights their complementary strengths in modeling long-term trends and short-term fluctuations. When both LSTM and Transformer were removed, the F1-score decreased to 0.76, approaching the performance of traditional machine learning methods. On the S&P 500 dataset, similar patterns were observed. The absence of WT led to a decrease in F1-score from 0.87 to 0.84, while removing LSTM or Transformer caused F1-scores of 0.82 and 0.80, respectively. Notably, removing both WT and LSTM resulted in the lowest F1-score of 0.77, reinforcing their key roles in long-term pattern extraction. Overall, these results demonstrate that the full integration of WT, LSTM, and Transformer is critical to the model's superior performance across different types of financial time series.
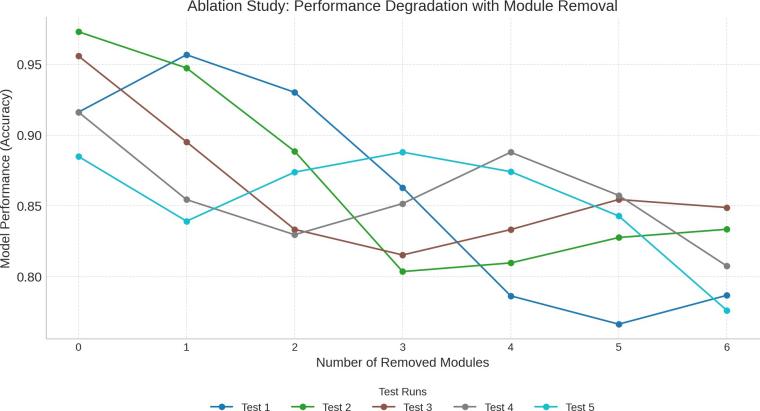
As illustrated in Figure 5, the ablation study results validate the synergy among WT, LSTM, Transformer, and the feature fusion layer in WaveLST-Trans. Compared to single-model approaches, the full architecture excels in capturing short-term anomalies, long-term trend changes, and multi-scale information fusion. Regardless of whether in high-frequency trading markets or long-term investment markets, the complete model outperforms all individual module variants, further verifying the rationality of the proposed model architecture.
This paper proposes WaveLST-Trans, a financial time series anomaly detection model based on an LSTM-Transformer hybrid architecture with wavelet transform (WT). The model first applies WT for multi-scale decomposition, feeding low-frequency components into LSTM to model long-term dependencies and high-frequency components into Transformer to capture short-term market fluctuations. These extracted features are then integrated in the feature fusion layer, and the anomaly detection module outputs an anomaly score. Compared to existing methods, WaveLST-Trans effectively models anomalies across different time scales, and ablation studies confirm the necessity of WT, LSTM, Transformer, and the feature fusion layer.Experiments on Binance (cryptocurrency market) and S&P 500 (stock market) datasets show that WaveLST-Trans outperforms mainstream models, improving F1-score and recall by 3%–10% in high-frequency markets and accuracy by 5%–9% in long-term trend markets.
The model maintains strong generalization and robustness across different financial environments. Future work will focus on optimizing the Transformer structure, adaptive anomaly thresholds, and integrating external market events to enhance adaptability. Additionally, further studies are needed to assess its performance under extreme financial events to ensure stability in sudden risk management.
 Copyright © 2025 by the Author(s). Published by Institute of Emerging and Computer Engineers. This article is an open access article distributed under the terms and conditions of the Creative Commons Attribution (CC BY) license (https://creativecommons.org/licenses/by/4.0/), which permits use, sharing, adaptation, distribution and reproduction in any medium or format, as long as you give appropriate credit to the original author(s) and the source, provide a link to the Creative Commons licence, and indicate if changes were made.
 IECE Transactions on Emerging Topics in Artificial Intelligence
ISSN: 3066-1676 (Online) | ISSN: 3066-1668 (Print)
Email: [email protected]

Portico
All published articles are preserved here permanently:
https://www.portico.org/publishers/iece/